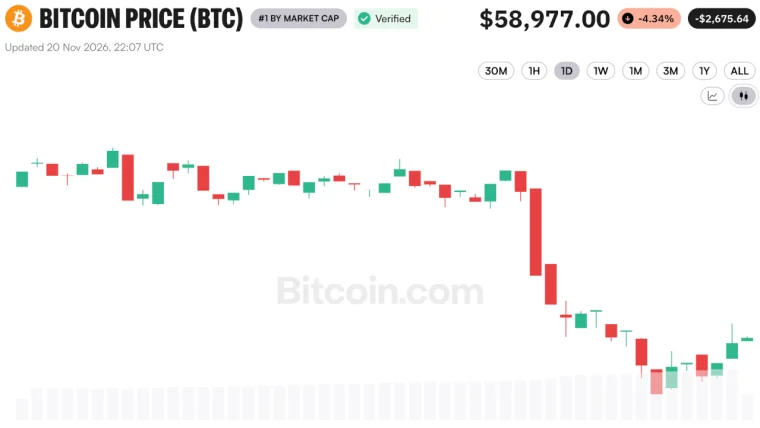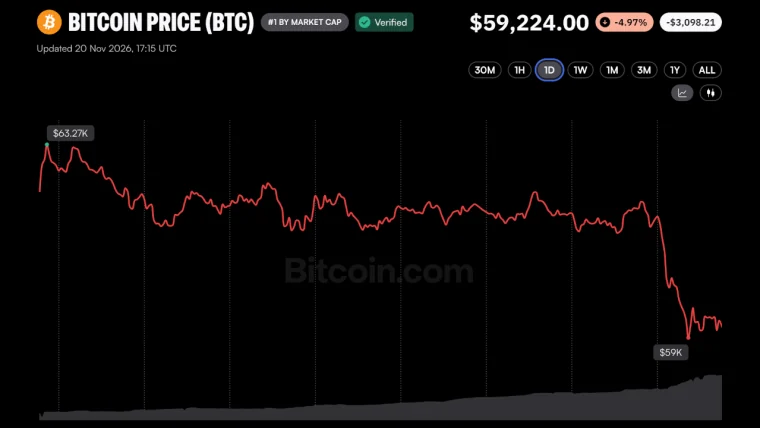



Bitcoin’s sell-off took it below the support level on a Fidelity strategist’s weekly chart. He remains bullish but warned that a fall well below the rising line would call his long-term outlook into question.
Fidelity Strategist Stays Bullish as Bitcoin Dips Below $58K — Here's Why
WRITTEN BY

SHARE

Key Takeaways
- Timmer cited bitcoin’s four-year cycle and his power law model as reasons to stay bullish.
- He found bitcoin’s return to the model’s support line discouraging.
- He warned that a fall well below support would call his entire framework into question.
How Far Below Support Would Bitcoin Have to Fall?
Jurrien Timmer, Fidelity Investments’ director of global macro, reaffirmed his bullish outlook for bitcoin after the Nov. 20 drop below $58,000. The strategist wrote on X:
“I remain bullish on bitcoin based on its four-year cycle and Power Law math, but it’s a bit disheartening that we are back again sitting on that power law support curve.”
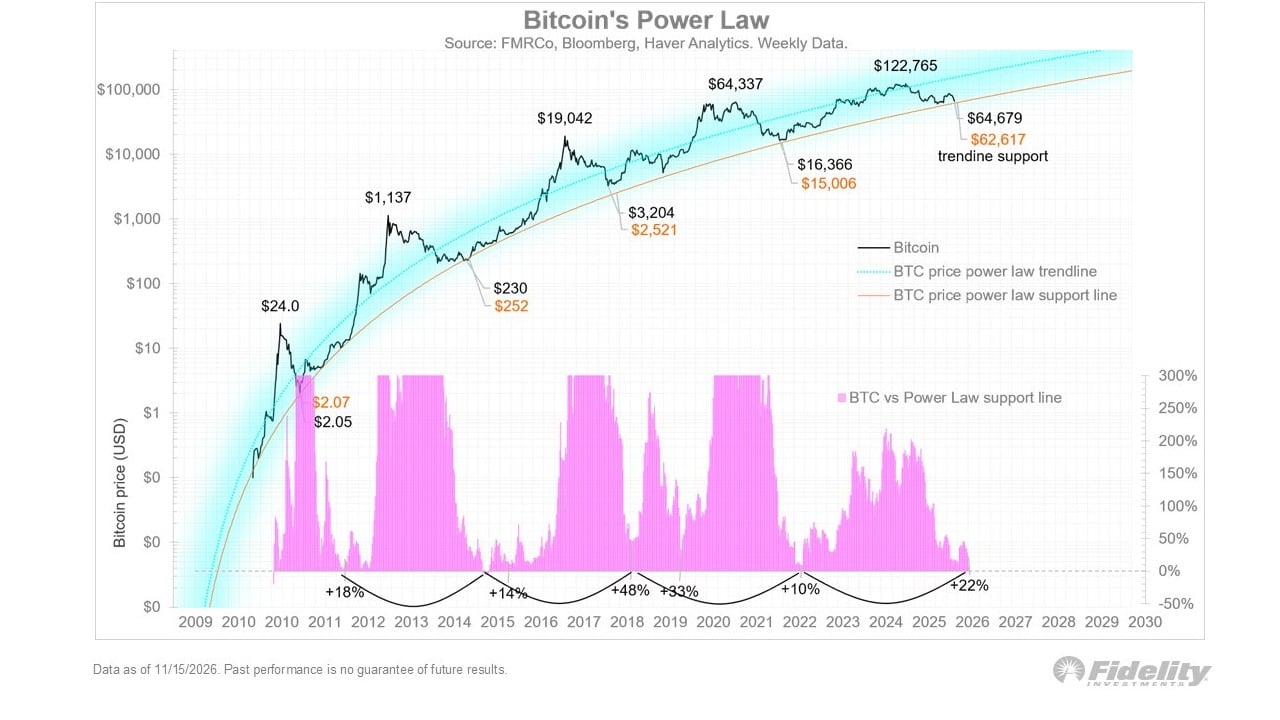
A power law describes a relationship in which doubling one quantity multiplies another by a fixed factor. Timmer applies that relationship to bitcoin’s age and price. The lower curve on his chart estimates where the price may find support as the network ages.
The weekly chart put bitcoin at $64,679 on Nov. 15, above the model’s $62,617 support line. Five days later, the strategist placed support near $62,000 and described it as rising. He gave no specific price or percentage decline that would change his view.
Timmer added: “If bitcoin’s price were to ever fall well below this support line (currently at $62k and rising), it would put my entire framework in doubt. Never a dull moment!”
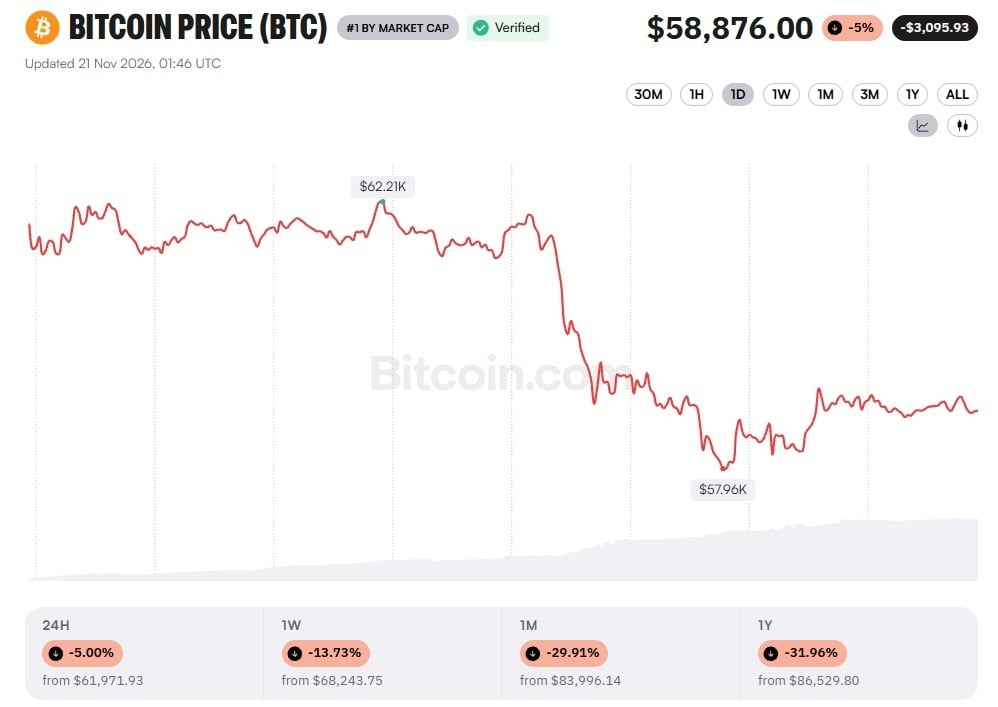
Bitcoin Dipped Below $58,000 on Nov. 20
Bitcoin had traded above $61,000 earlier on Nov. 20 before losing nearly $3,000 between 11 a.m. and noon Eastern. The slide later reached about $57,960, roughly 7.4% below the support level on Timmer’s Nov. 15 chart. As of 8:46 p.m. Eastern, bitcoin was down about 5% over 24 hours and more than 13% over seven days.
In February, the strategist identified an attractive entry point near $65,000. Bitcoin subsequently touched about $57,800 in late June before recovering over the summer.
By September, bitcoin was back near $80,000. The strategist saw a possible path to $100,000 after bitcoin formed two lows. The $100,000 projection depended on a breakout above $80,000.
Does Bitcoin Still Follow a Four-Year Cycle?
The strategist also drew on the historical pattern of bitcoin’s market peaks and downturns. Under the bitcoin halving schedule, the network cuts the amount of new bitcoin miners receive per block in half every 210,000 blocks.
Fidelity Digital Assets analyst Zack Wainwright examined the four-year market cycle in February and found that bitcoin’s volatility had declined even as its price climbed above $126,000 in October 2025. Earlier peaks typically coincided with widening price swings.
In January 2026, just months after the record, Wainwright counted 17 occasions when bitcoin’s volatility over the preceding year reached a new low. Wainwright concluded that the familiar four-year pattern may no longer apply.

Arthur Hayes said he was increasing crypto exposure ahead of Anthropic's expected stock market debut next week. His near-term optimism…
Read Now: ‘Anthropic IPO Is Going to Rip’: Arthur Hayes Loads Up on Crypto Ahead of Debut

About the author
WRITTEN BYKevin Helms
Kevin Helms is a cryptocurrency journalist specializing in Bitcoin, blockchain regulation, and global digital asset markets.