


On Sunday, XRP is trading at $2.99 with a market capitalization of $178 billion and a 24-hour trading volume of $3.34 billion. The intraday price range sits narrowly between $2.97 and $3.01, suggesting a temporary equilibrium between buyers and sellers.
XRP Price Watch: Price Action Tightens in Micro Range as Bulls Seek Control

This article was published more than a month ago. Some information may no longer be current.
WRITTEN BY

SHARE

XRP
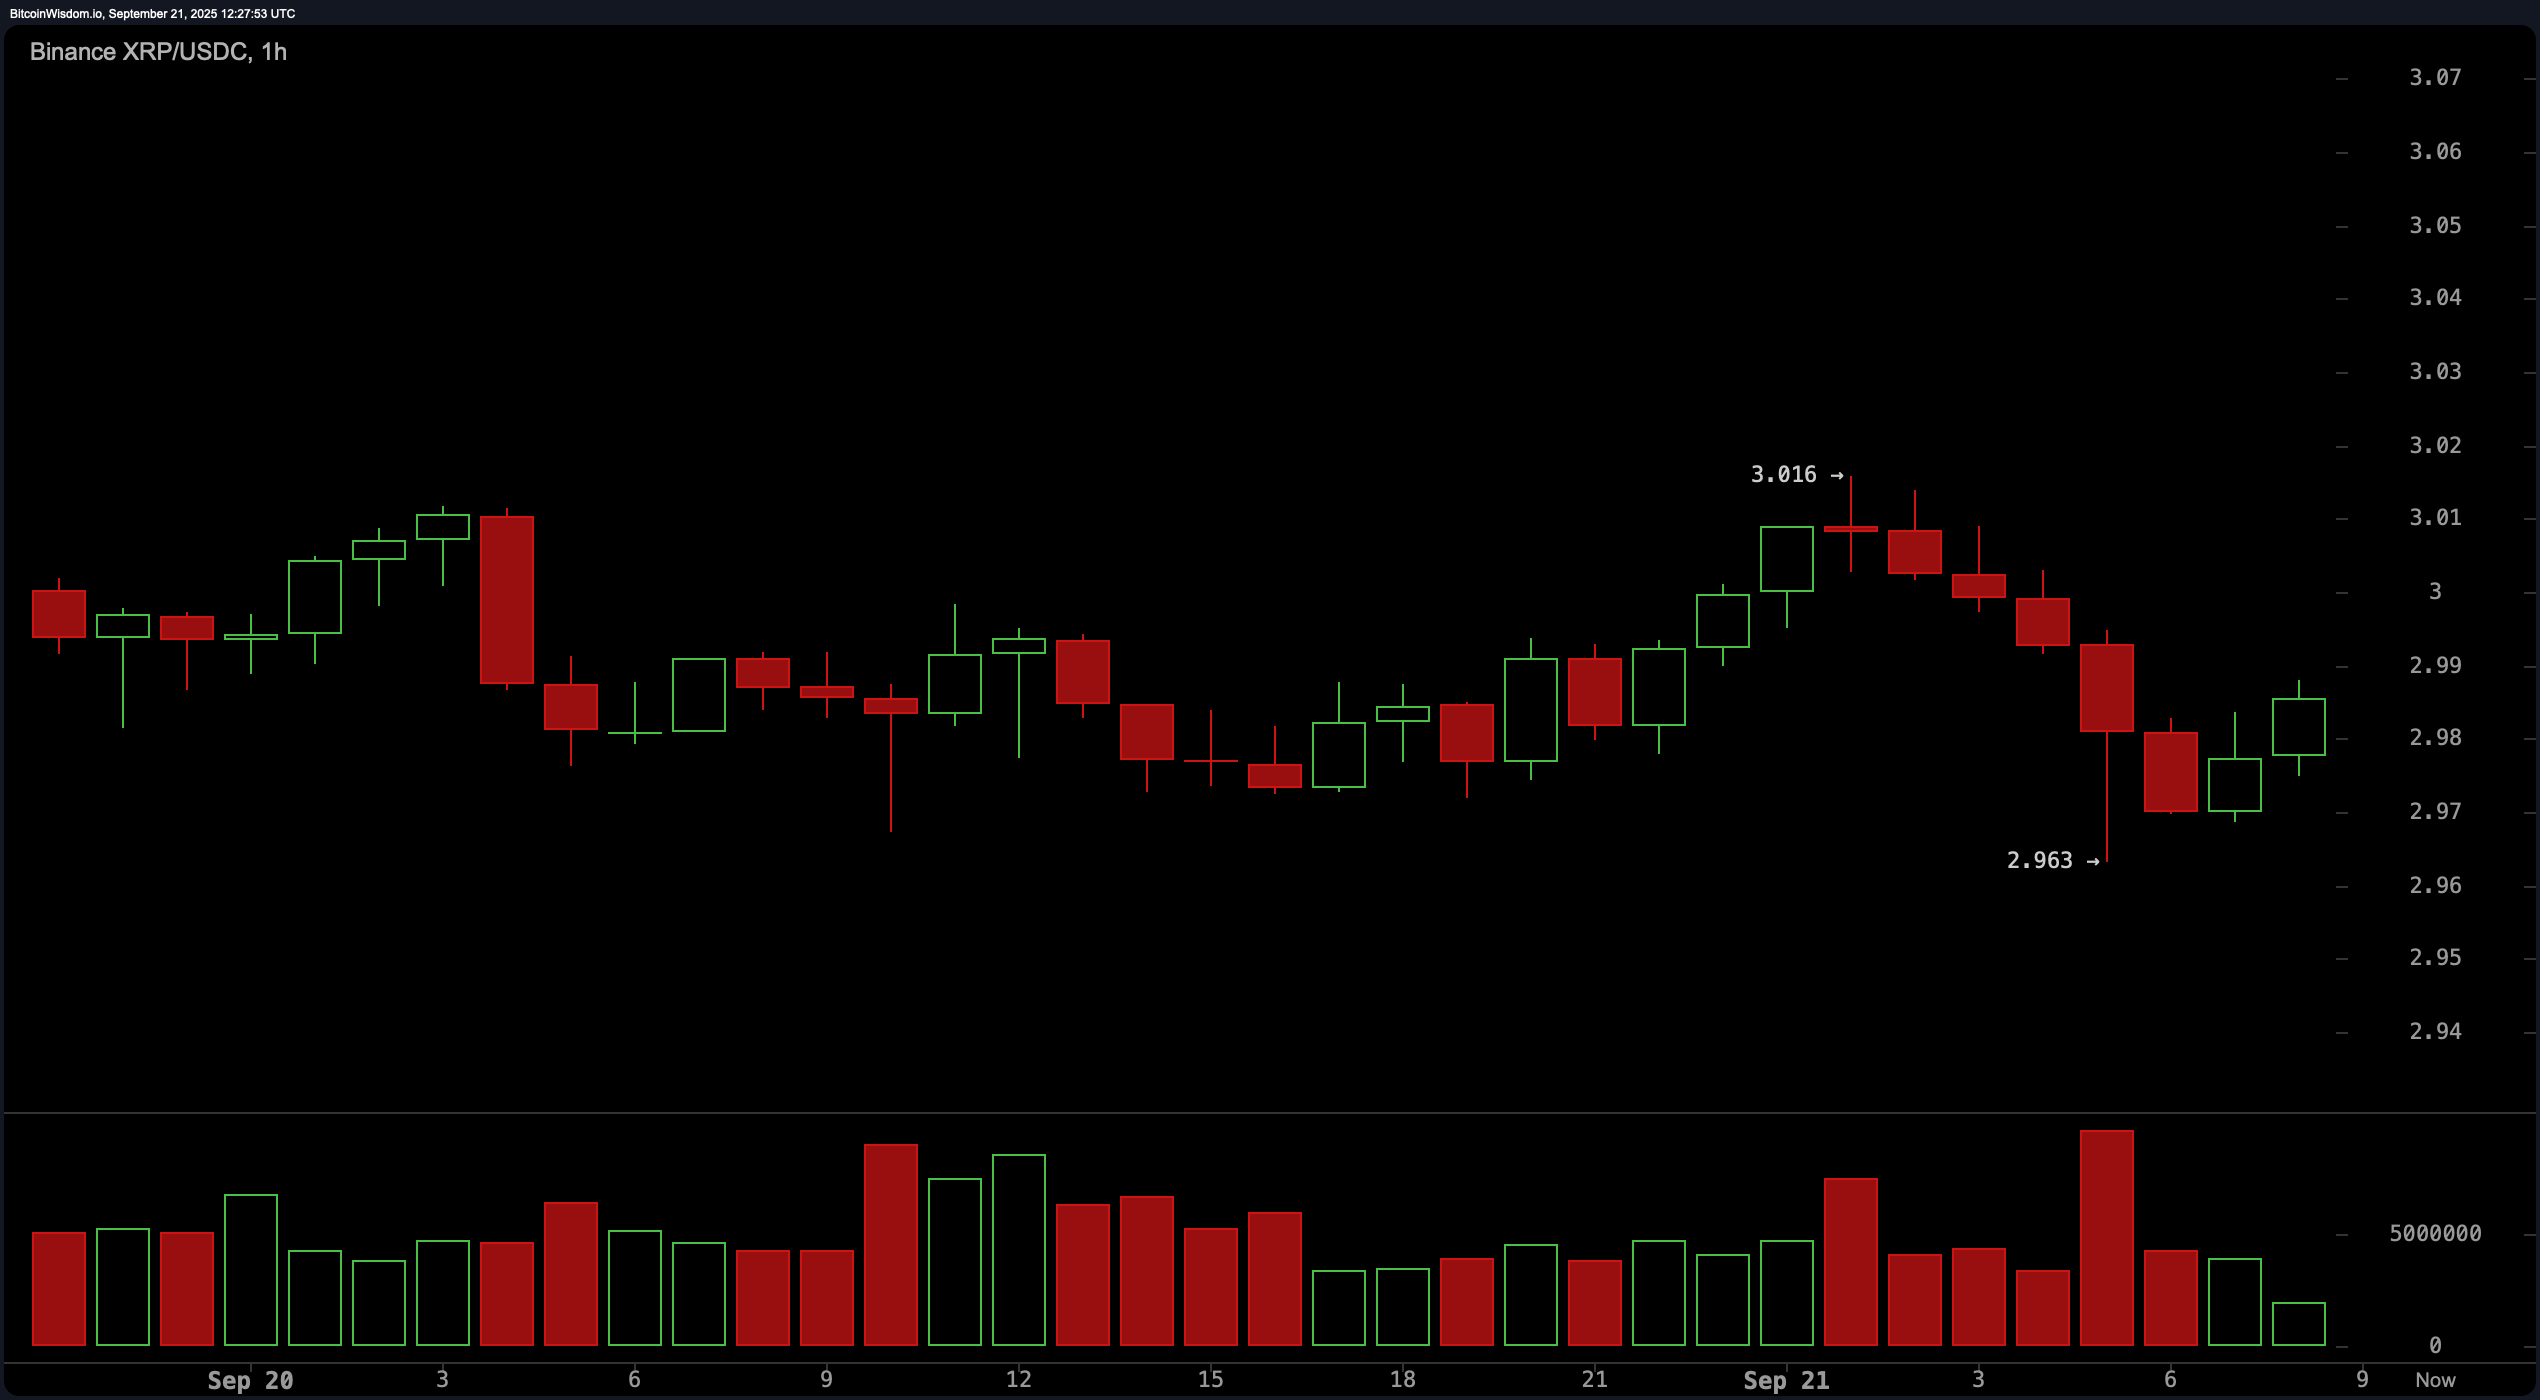
The 1-hour chart reflects a period of choppy, range-bound trading, typical of market indecision. After rebounding from a local low at $2.963, XRP has been printing higher lows, but persistent resistance near the $3.00 level is capping upward momentum.
A volume spike during a recent dip suggests possible accumulation, which could precede a breakout. Scalpers may find buying opportunities in the $2.95–$2.97 range with tight stop-losses just below $2.94. A confirmed break above $3.02 could trigger bullish momentum, particularly if accompanied by a volume surge.
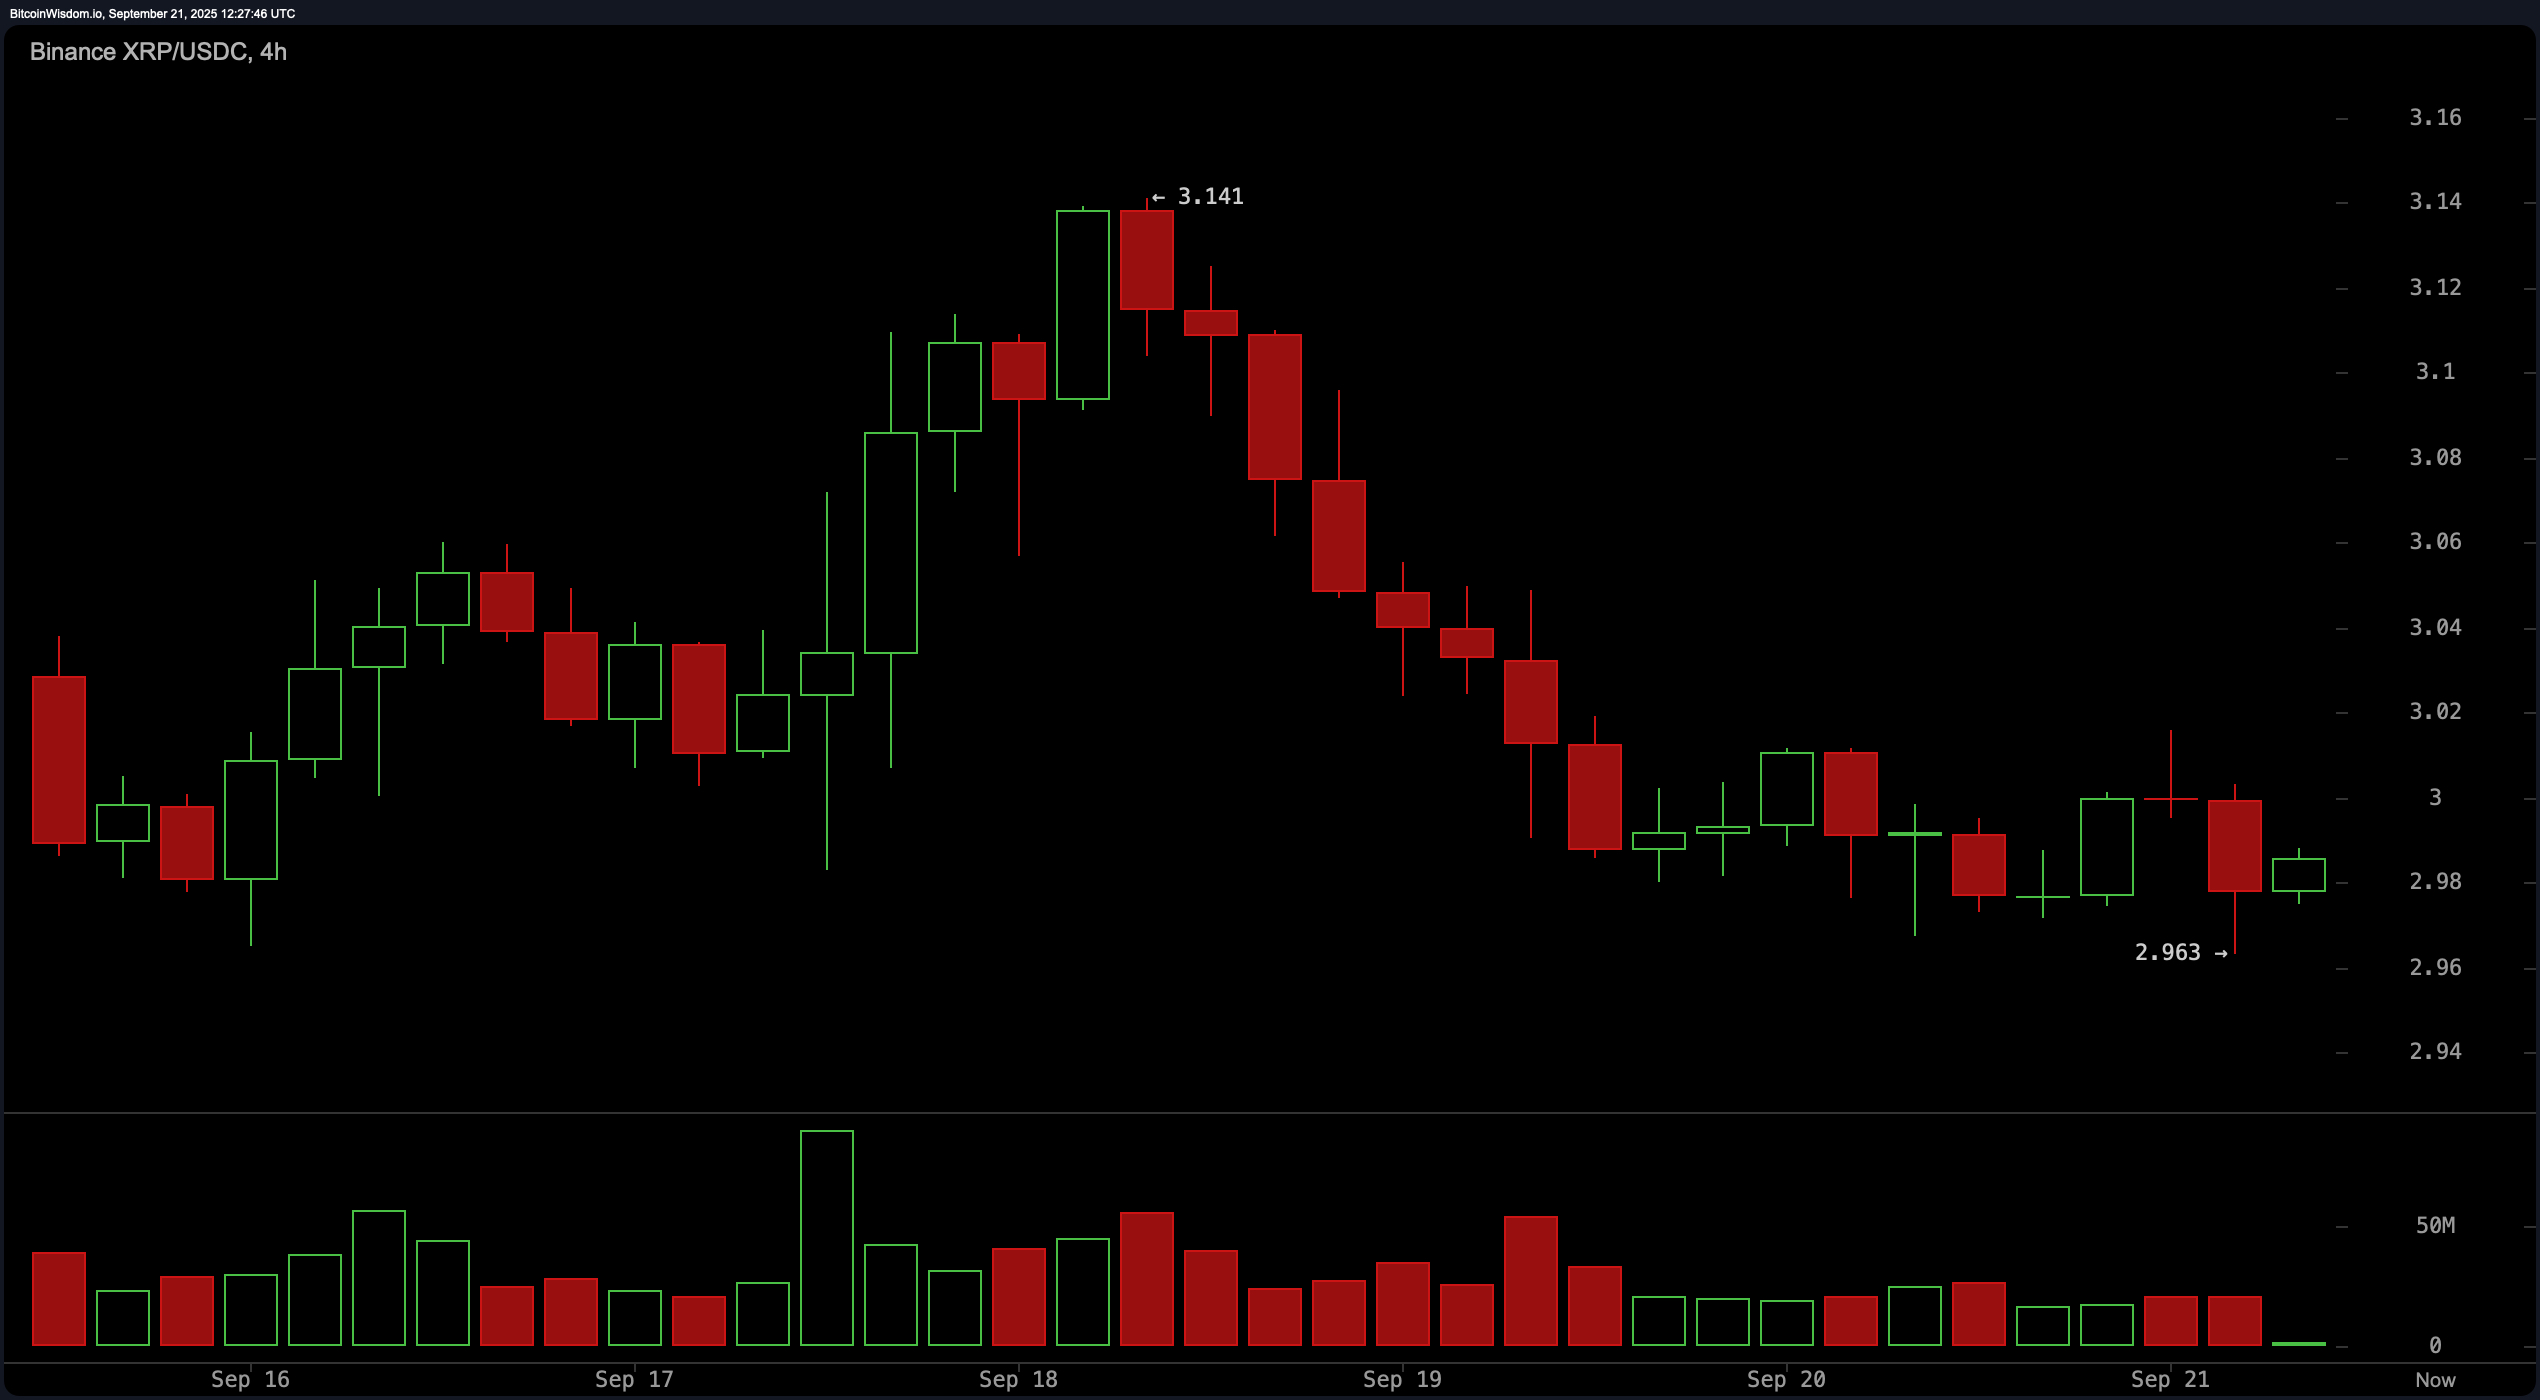
On the 4-hour chart, the prevailing trend remains short-term bearish, stemming from a recent high at $3.141. A consistent pattern of lower highs and lower lows has taken XRP to a local bottom at $2.963, which overlaps with the daily chart’s consolidation zone. Notably, declining volume on successive red candles points to diminishing bearish pressure. This sets the stage for a potential bullish reversal if price action confirms with a break and close above the $3.00–$3.02 area. Traders should monitor this level closely, as it could signal the end of the current downtrend and the start of a new upward leg.
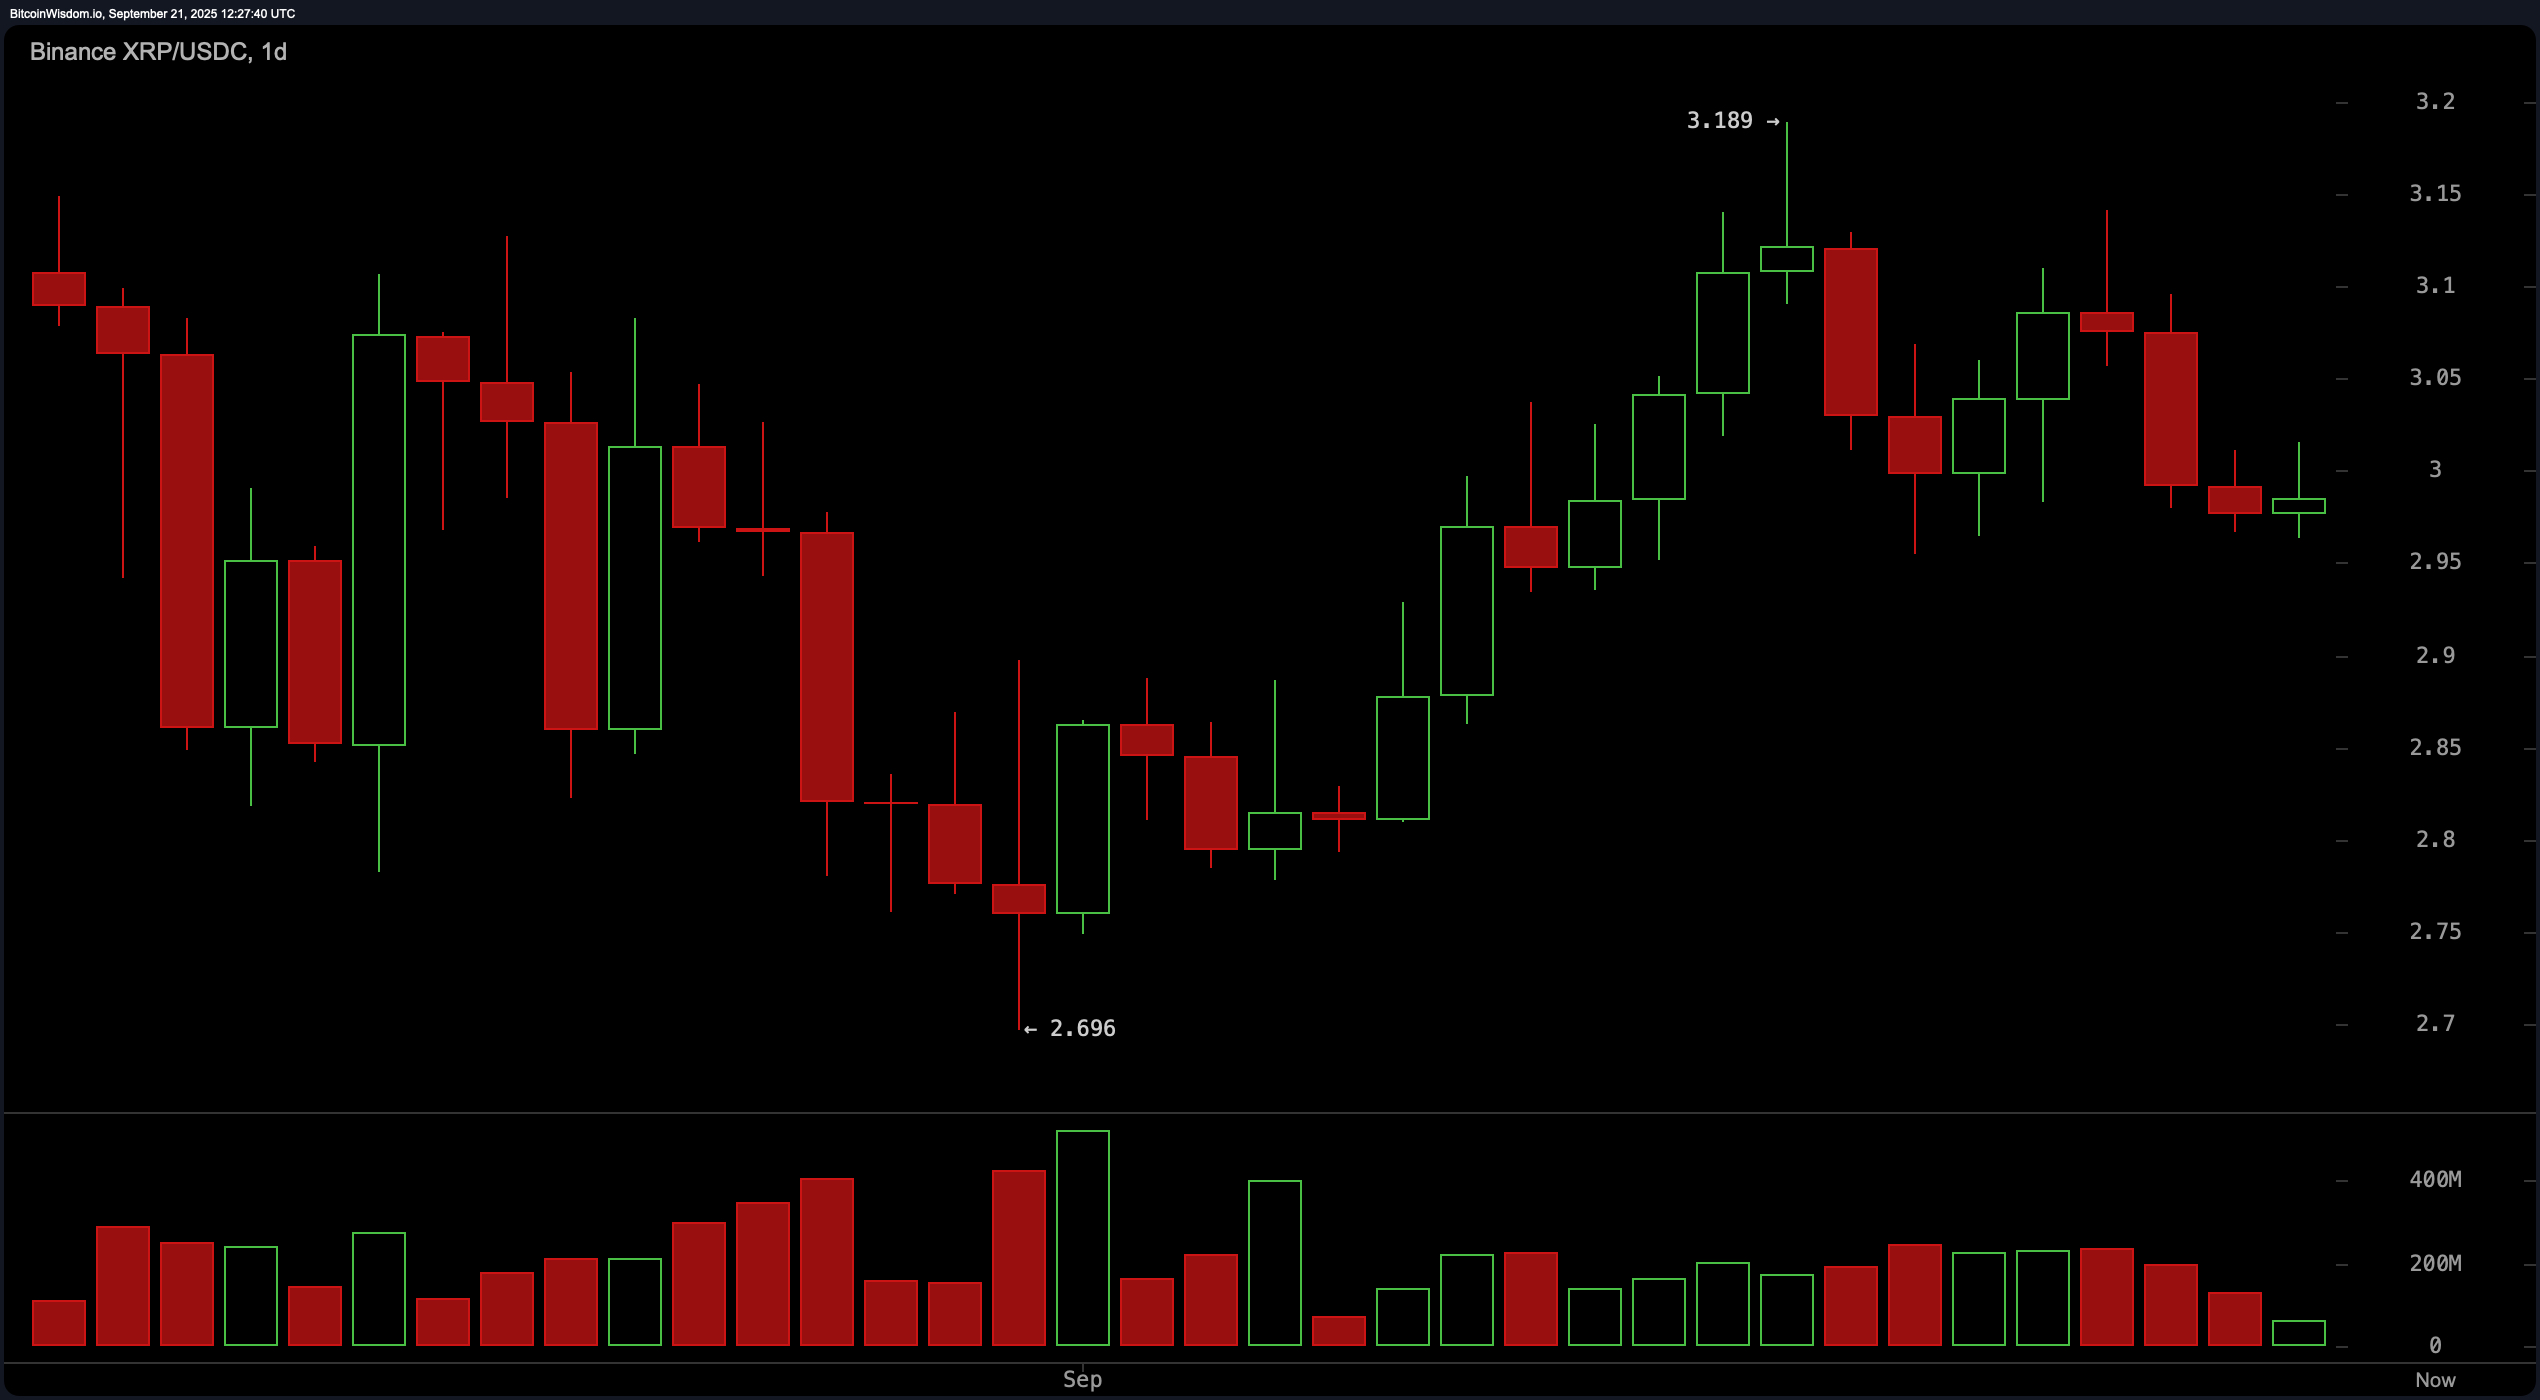
From the daily chart perspective, XRP is exhibiting signs of short-term consolidation within a broader neutral-to-slightly-bullish trend. The price has retreated from a recent swing high at $3.189 and is now hovering near the $2.97–$2.98 zone. Despite the pullback, the price structure indicates higher highs and a bounce off a recent low of $2.696, signaling underlying strength. Volume on the recent red candles is waning, reinforcing the notion of weak selling momentum. Key support rests at $2.80–$2.85, while resistance stands at $3.10–$3.18. A decisive breakout above $3.10 with robust volume could ignite renewed bullish interest.
A review of XRP’s oscillators paints a largely neutral technical environment. The relative strength index (RSI) at 49.86, Stochastic at 43.97, commodity channel index (CCI) at 16.04, average directional index (ADX) at 14.66, and Awesome oscillator (AO) at 0.082 all suggest a lack of strong directional momentum. Only the momentum indicator is flashing a bearish signal at −0.056, while the moving average convergence divergence (MACD) at 0.018 is indicating a bullish crossover. The mixed oscillator signals suggest traders should exercise caution and wait for stronger confirmation from price action and volume before initiating larger positions.
Moving averages (MAs) offer a more constructive outlook over the medium to long term. The exponential moving average (EMA) for the 10-period at $3.008 and the simple moving average (SMA) for the 10-period at $3.041 are both showing bearish signals. However, longer-term indicators such as the EMA (30) at $2.984, SMA (30) at $2.947, EMA (50) at $2.958, and SMA (50) at $3.005 show mixed signals, while the EMA (100) at $2.837 and SMA (100) at $2.819, along with EMA (200) at $2.592 and SMA (200) at $2.529, are all pointing to bullish conditions. This divergence between short-term and long-term averages suggests that while short-term momentum may be under pressure, the broader trend remains bullish.
Bull Verdict:
If XRP breaks and holds above the $3.02 resistance level on strong volume, especially with confirmation across the 1-hour and 4-hour charts, a bullish continuation toward $3.10 and possibly $3.18 is likely. The alignment of higher time frame moving averages and declining selling momentum supports a favorable risk-reward setup for long positions.
Bear Verdict:
If XRP closes below $2.94 with a surge in volume, it would invalidate the current support structure and increase the probability of a retest toward the $2.80 zone. In this scenario, short-term bearish pressure could dominate, and bullish setups should be avoided until a new support base is confirmed.