


Over the last 60 minutes, XRP currently fluctuates between $2.69 and $2.75, marking a 12.5% daily gain, with its valuation reaching $158 billion. Trading activity over 24 hours totals $6.58 billion, while intraday price swings span $2.42 to $2.77. The digital asset on Friday lingers 18.7% beneath its historic peak.
XRP Price Analysis: Bulls Take Control as XRP Surges 12.5% – Is $3 Next?

This article was published more than a month ago. Some information may no longer be current.
WRITTEN BY

SHARE

XRP
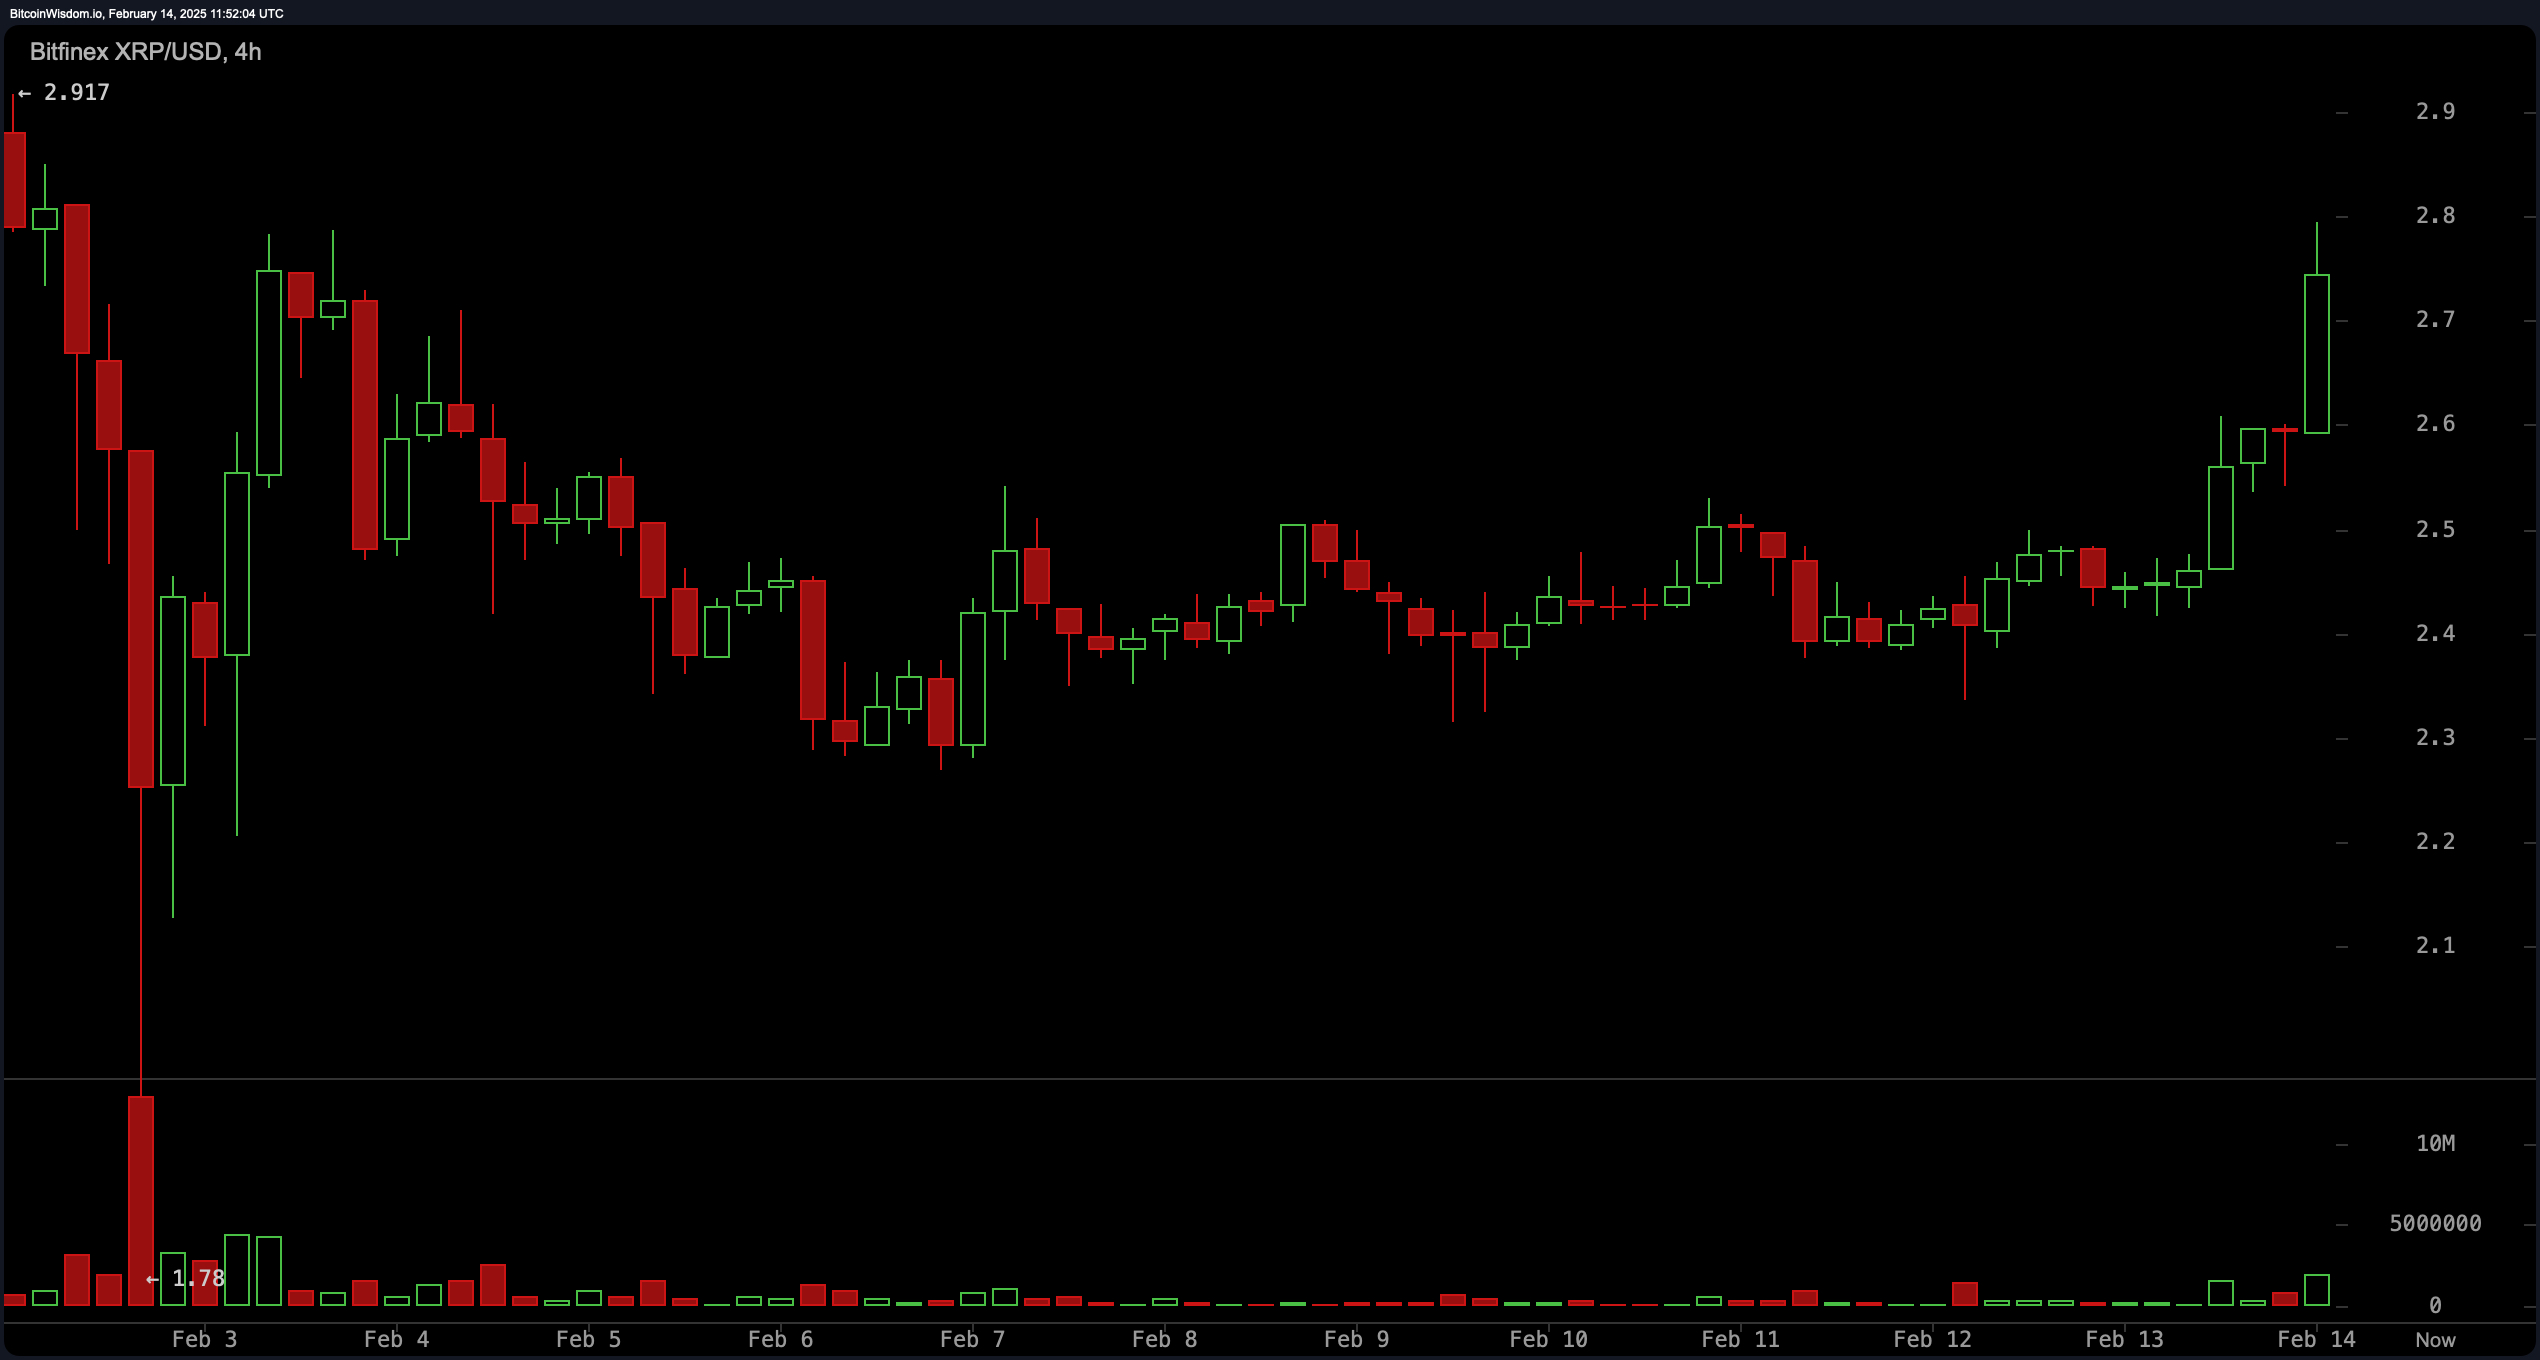
XRP’s hourly chart reveals a vigorous upward thrust, propelling prices from $2.33 to $2.79. Elevated transaction volumes validate heightened investor appetite at elevated valuations. Should a retreat occur, strategic entries might cluster near $2.60-$2.65, while the $2.80-$2.90 band poses a formidable barrier. A dip under $2.50 could signal a waning drive, prompting prudence among tactical traders.
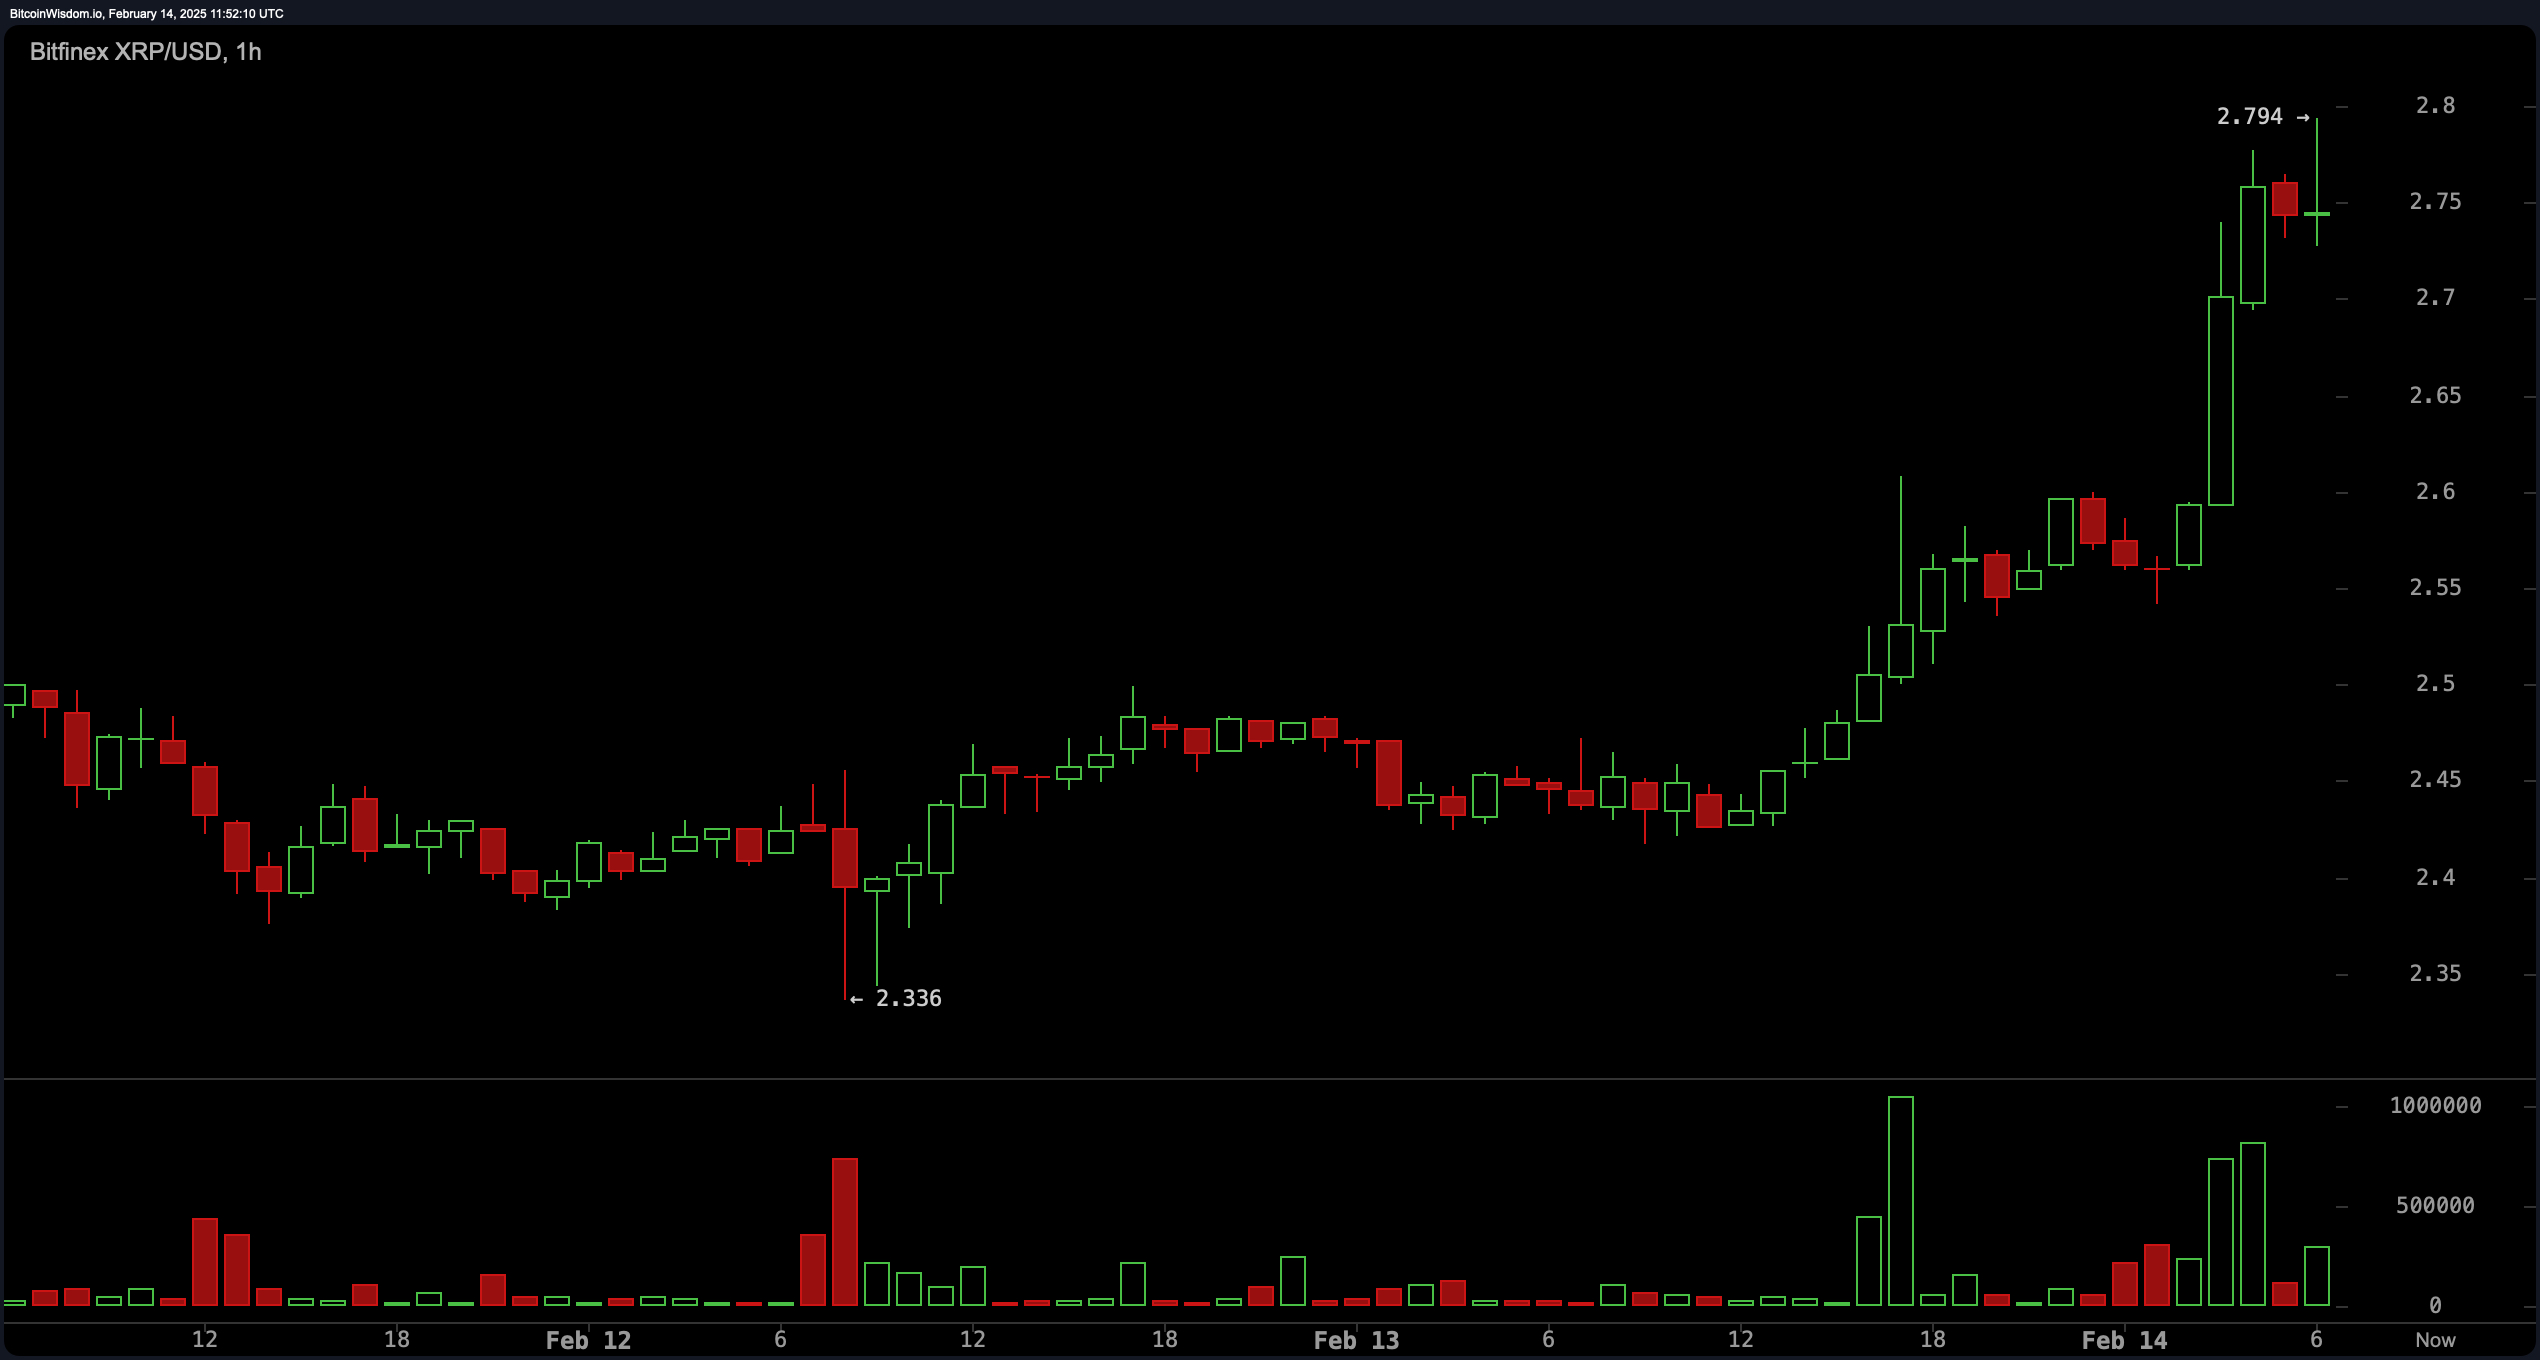
Analyzing the four-hour timeframe, XRP exhibits resilience after recent liquidations, anchoring stability between $2.20 and $2.40. The $2.90 zone looms as a probable friction point for sellers. Expanding turnover during this breakout phase amplifies optimistic projections. Holding above $2.70 may invite further advances, though profit extraction could intensify near $3.00. Prudent positions might deploy protective stops beneath $2.50 to mitigate reversal risks.
Zooming out, XRP’s daily perspective maintains an upward trajectory despite recent pullbacks. A fortified base at $1.78 demonstrates reinforced accumulation at discounted tiers. The $3.40 threshold emerges as a critical battleground, historically met with distribution. Sustained positioning above $2.60 may catalyze renewed advances, with strategic buyers monitoring potential breaches beyond $3.00.
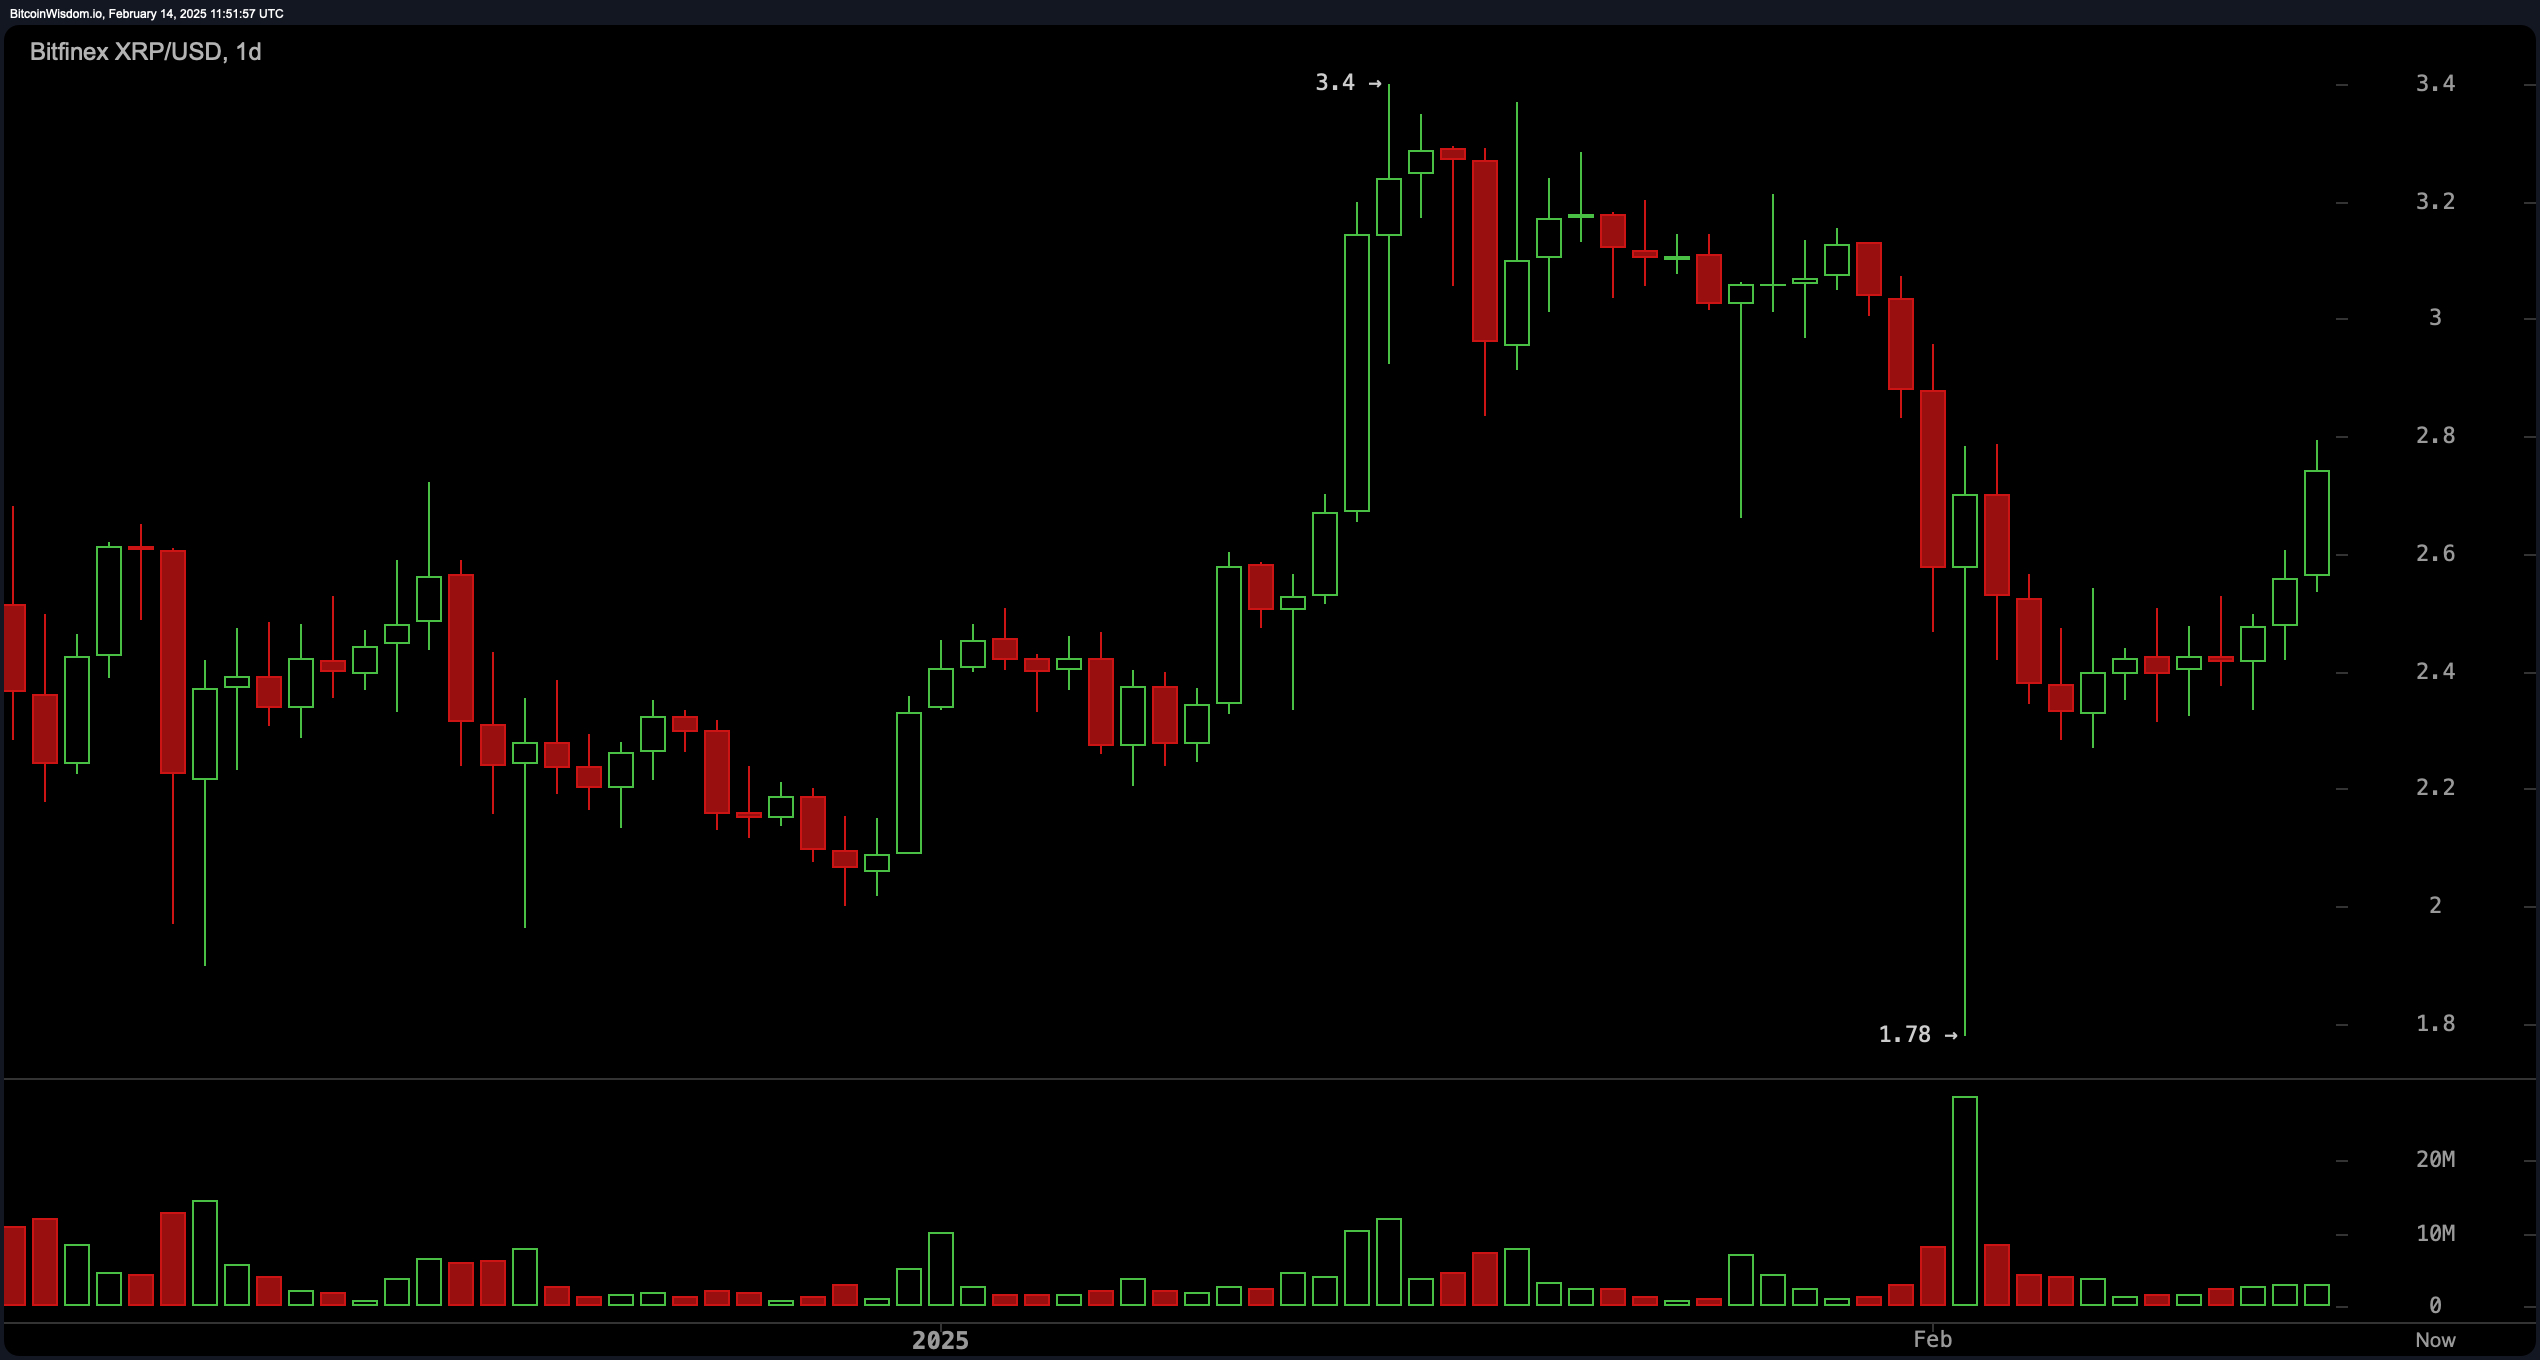
Momentum oscillators hover in equilibrium: The relative strength index (RSI) at 54.14, Stochastic at 61.04, and CCI at 4.71 reflect balanced sentiment. An ADX reading of 34.65 implies a modest trend conviction, while a +0.21 momentum indicator flashes bullish. Contrastingly, the moving average convergence divergence (MACD) lingers at -0.07, advising measured optimism.
Moving averages showcase a nuanced yet optimistic portrait. EMAs and SMAs across 10- to 200-period spans predominantly endorse accumulation, with only the 30-period SMA at $2.84 suggesting distribution. The 200-period EMA ($1.69) and SMA ($1.38) fortify long-term growth narratives. Should prices maintain strategic footholds, XRP may extend its upward dance in subsequent trading windows.
Bull Verdict:
XRP’s recent breakout, supported by strong volume and favorable moving averages, suggests continued bullish momentum. If the price holds above key support levels and maintains strength above $2.60, a move toward $3.00 and potentially $3.40 is likely. The overall trend remains positive, making XRP an attractive option for traders and investors anticipating further gains.
Bear Verdict:
Despite recent gains, XRP faces resistance near $2.90, with the moving average convergence divergence (MACD) level signaling a sell. If selling pressure intensifies and price action falls below $2.50, a deeper retracement toward $2.20 or lower could occur. Without sustained buying support, XRP may struggle to maintain its uptrend, increasing the risk of further downside.
About the author
WRITTEN BYJamie RedmanNews Lead
Jamie Redman is the News Lead at Bitcoin.com News and a financial technology journalist based in Massachusetts.