XRP is trading at $2.12 to $2.13 with a market capitalization of $123.66 billion and a 24-hour volume of $2.06 billion, bouncing between $2.05 and $2.14 in a tight range that hints at brewing volatility.
XRP Price Analysis: Bullish Flag Emerges as XRP Eyes Breakout Above $2.15
This article was published more than a month ago. Some information may no longer be current.
WRITTEN BY
SHARE

XRP
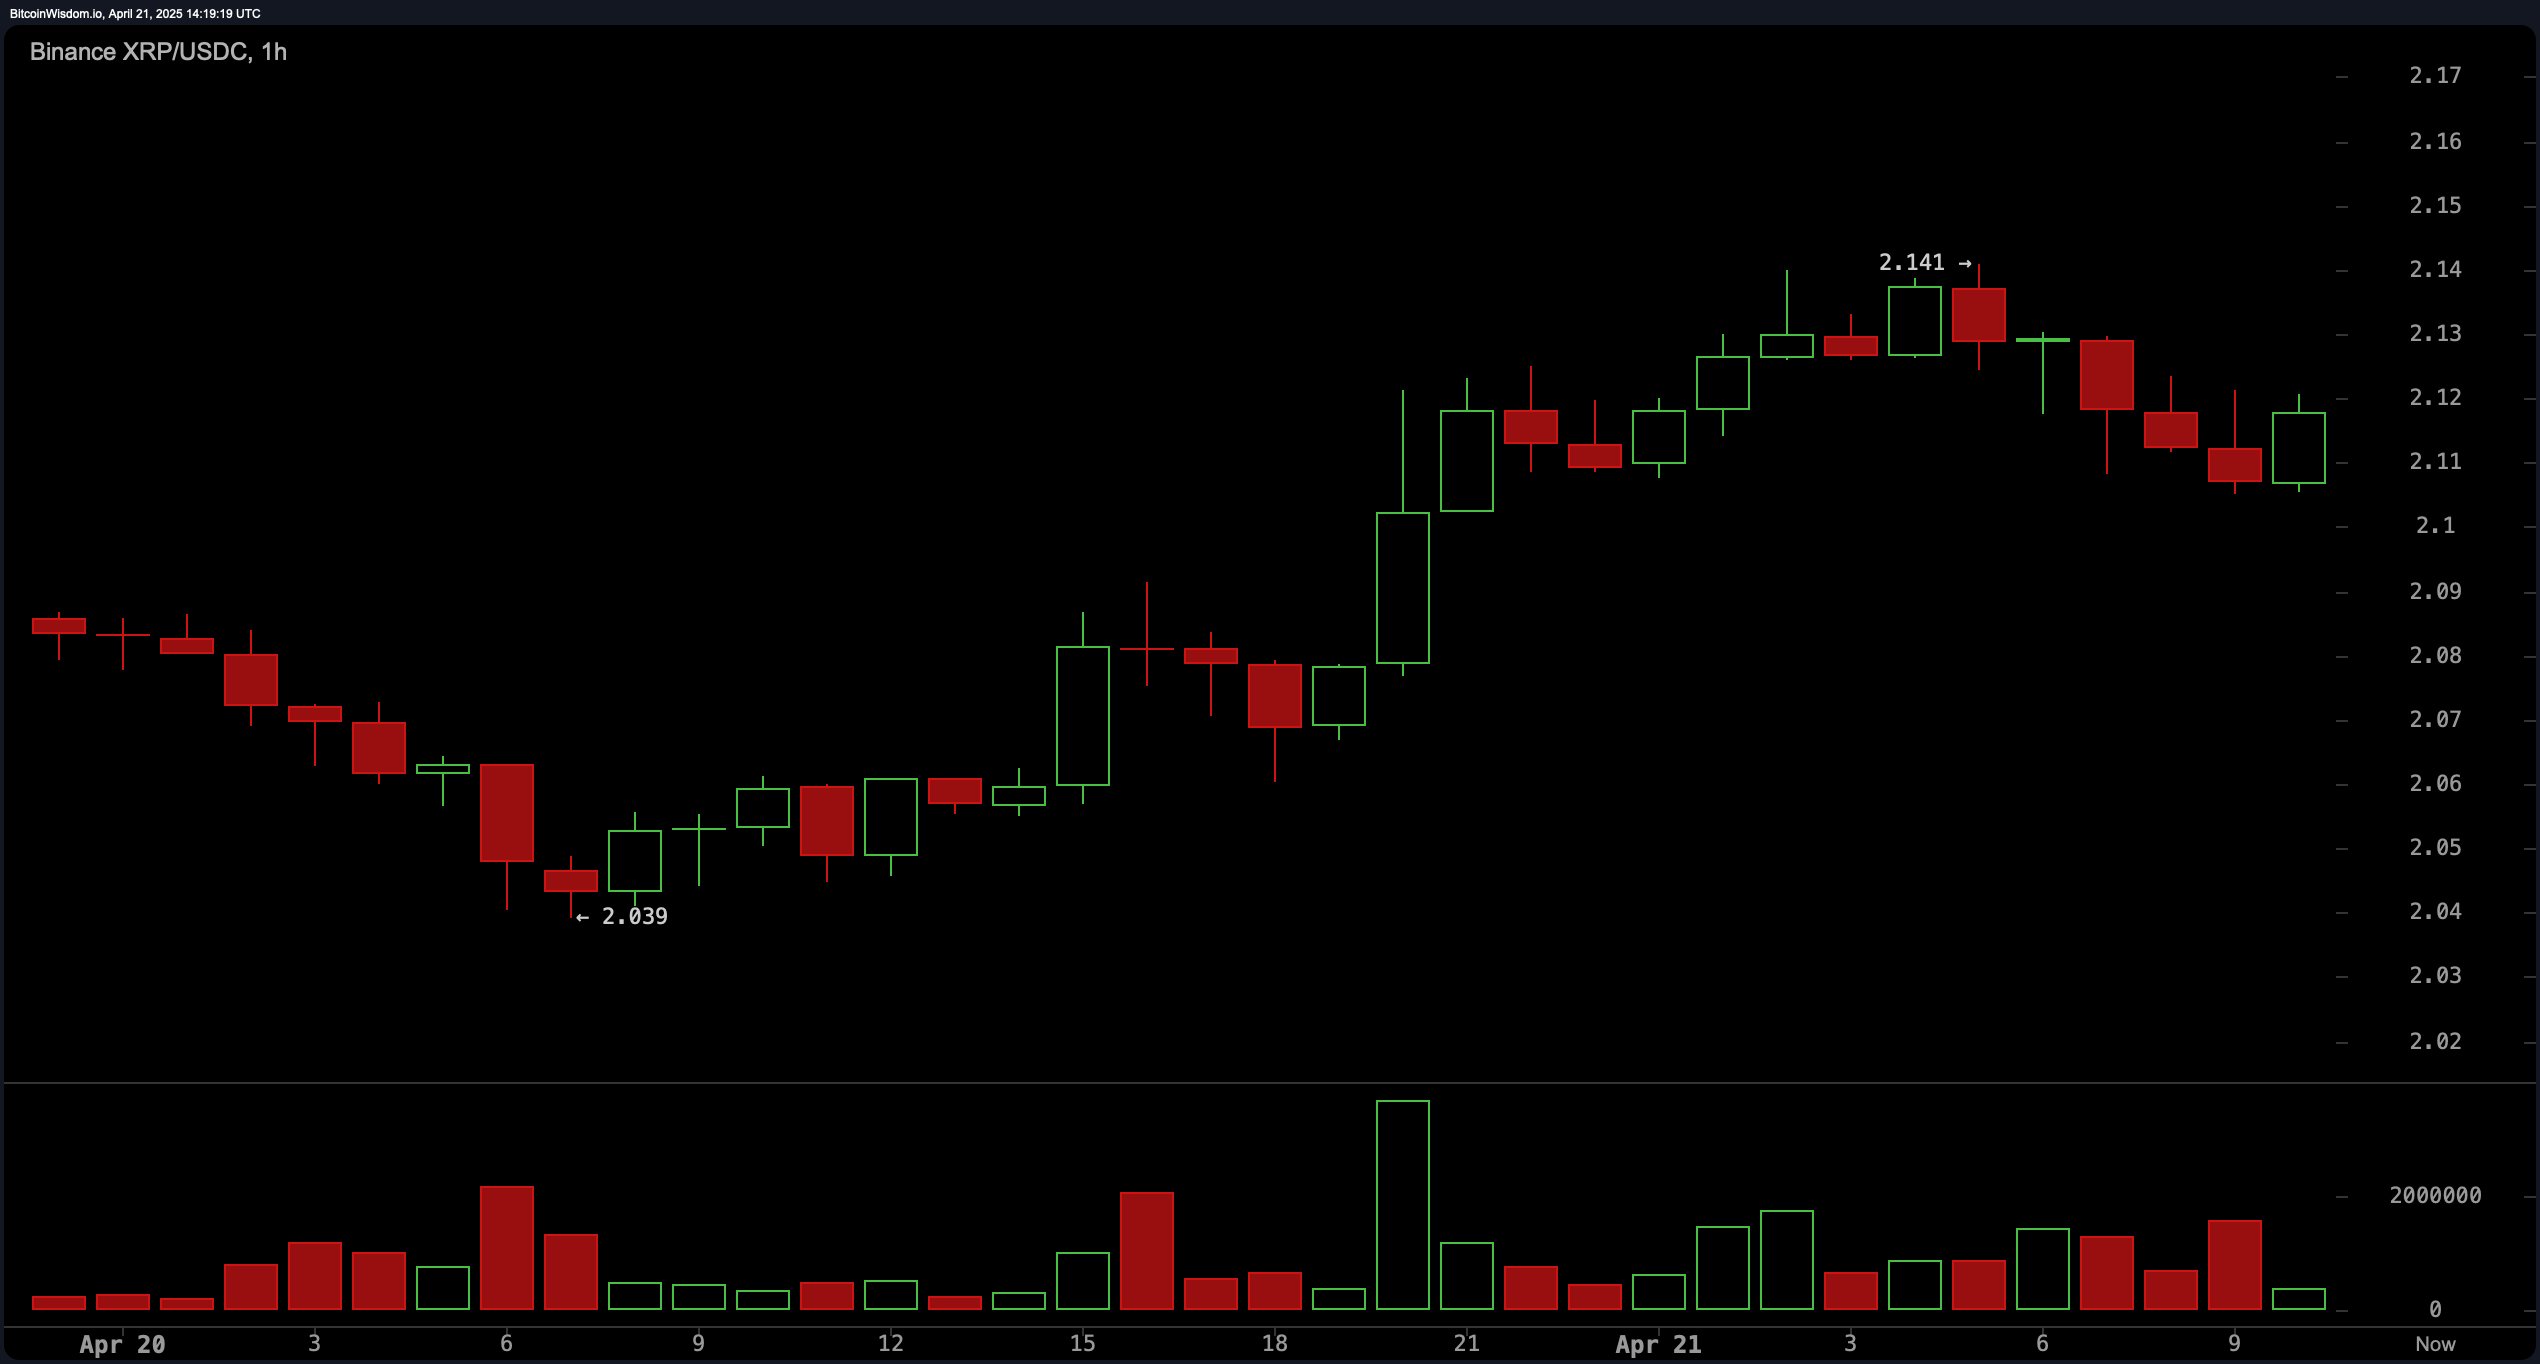
XRP’s short-term technical setup on the 1-hour chart exhibits a bullish trend, having steadily climbed from $2.03 to $2.14 since April 20. The pattern currently forming suggests a bullish flag, typically indicative of potential continuation in price movement, assuming volume aligns with the trend. Price action is consolidating just above the $2.11 level, where it has shown resilience amid minor pullbacks. Confirmation of support at $2.10 or a clean breakout above $2.14 would strengthen the bullish case. For traders managing risk, stops below $2.08 appear prudent while keeping exit targets between $2.20 and $2.25 in view.
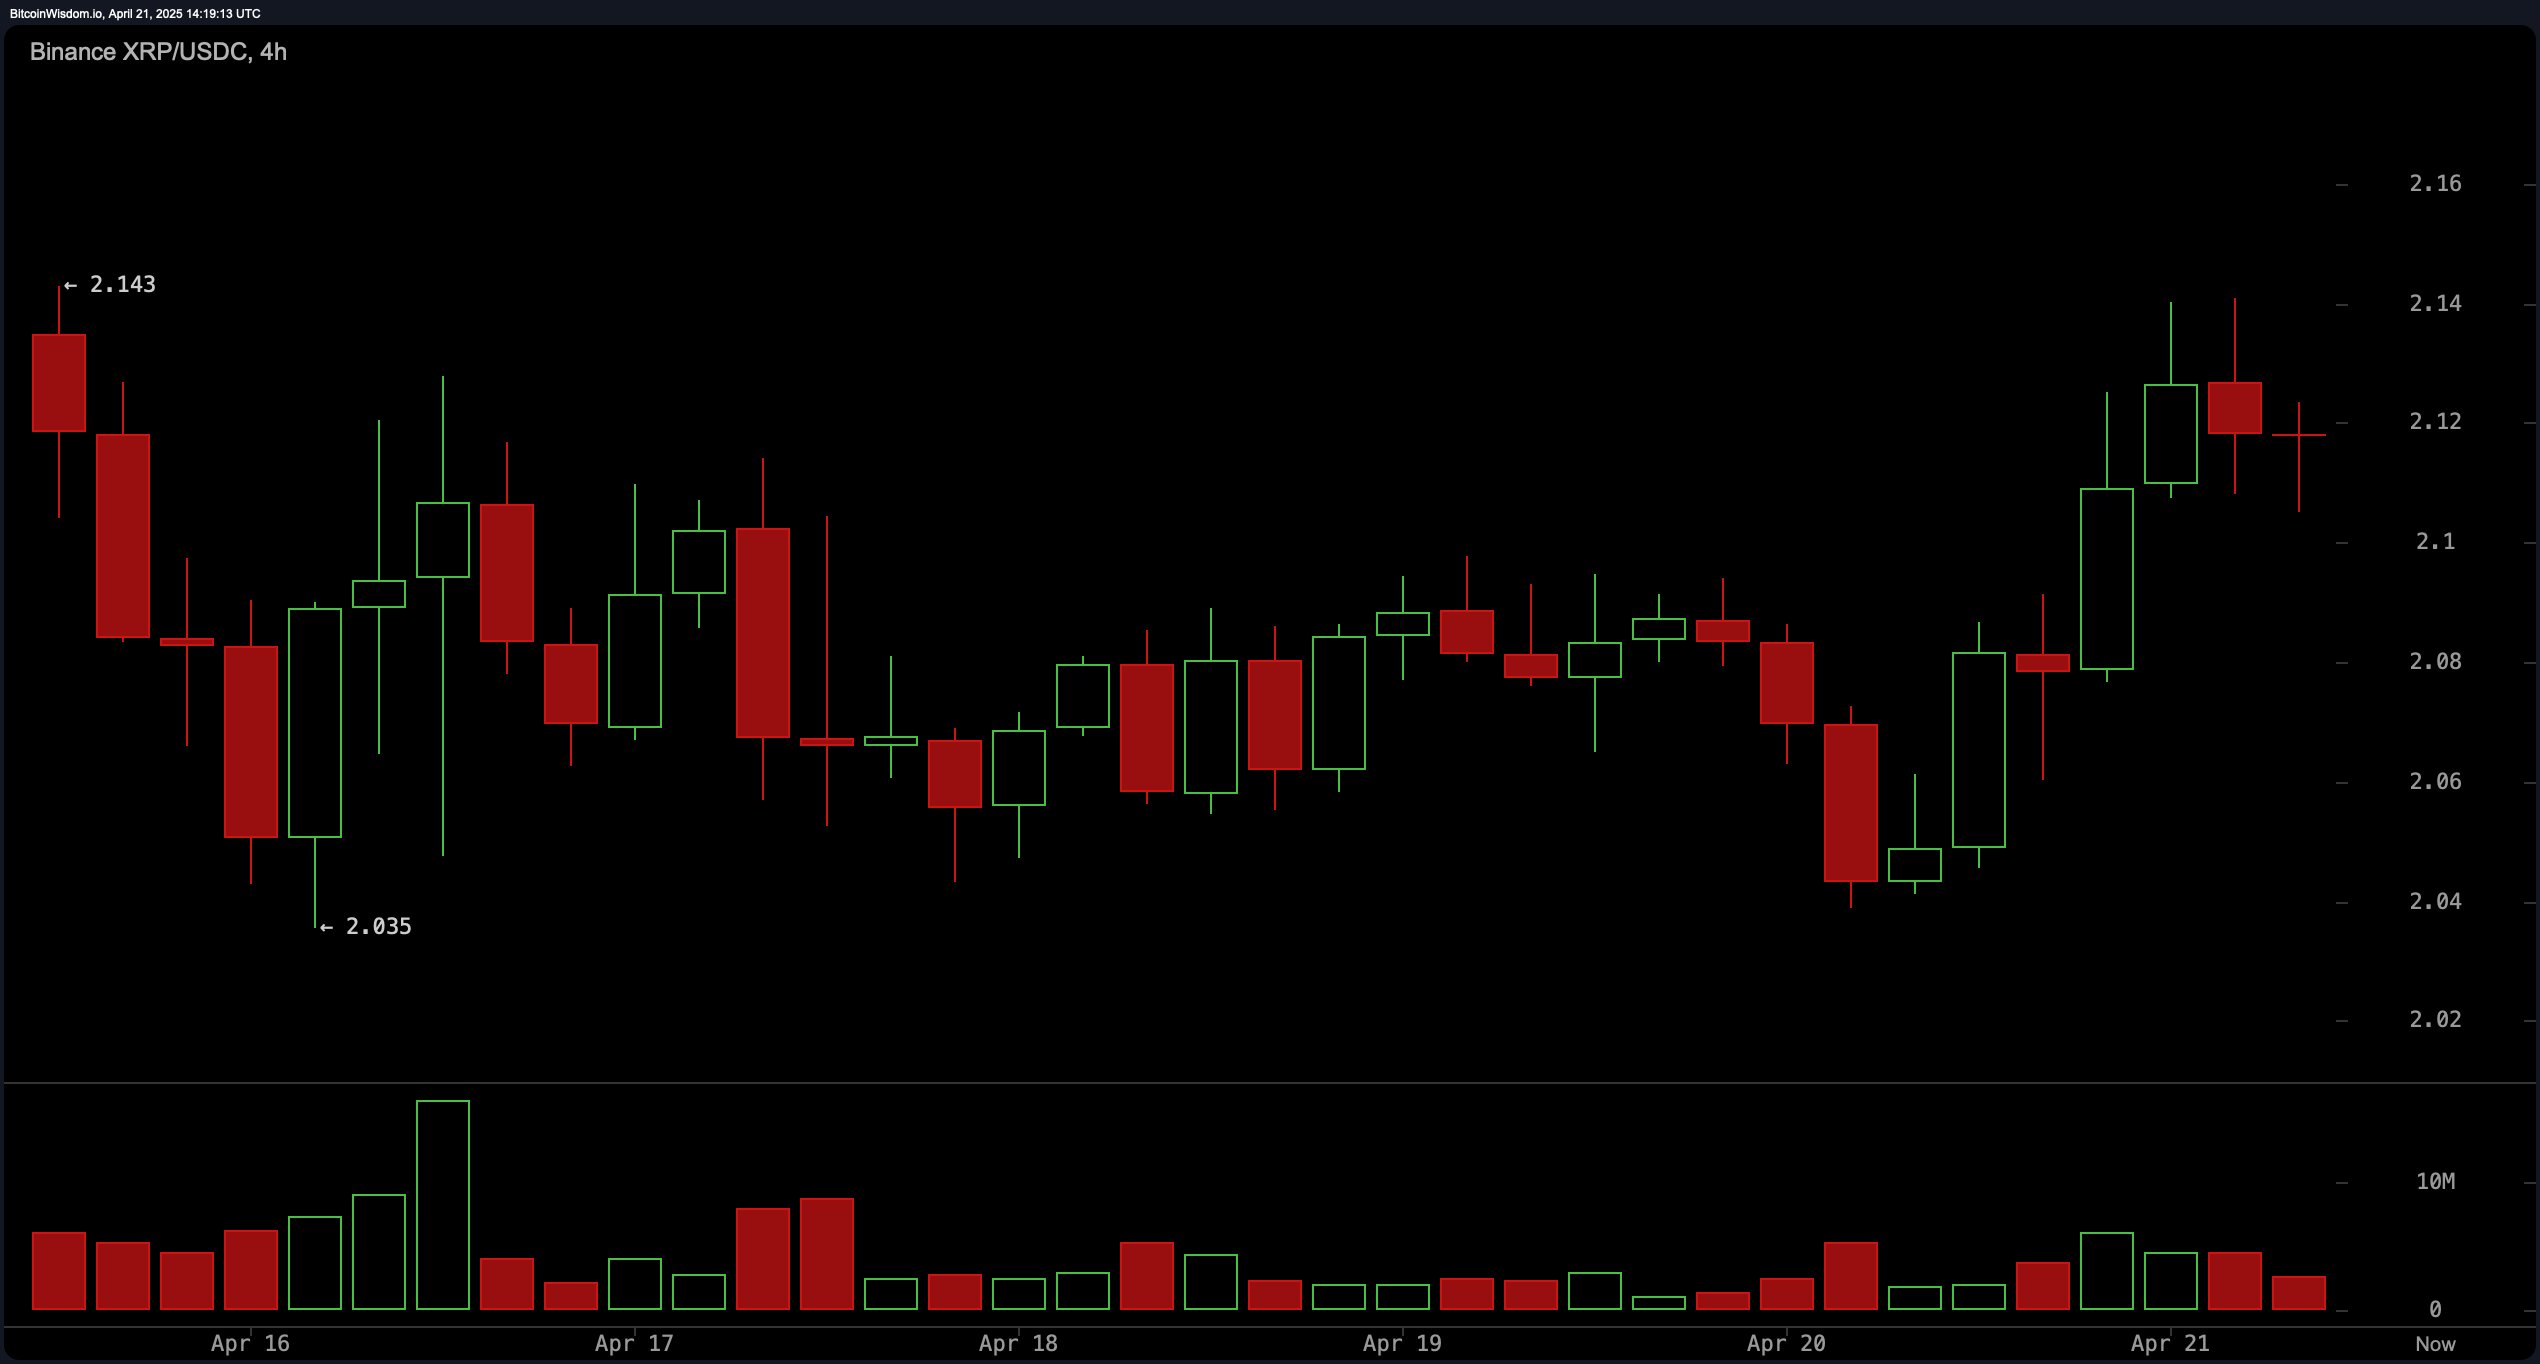
On the 4-hour chart, XRP continues to consolidate within a broadening range from $2.03 to $2.14, underpinned by the formation of higher lows—a characteristic early indicator of accumulation. The slight upward bias in this time frame is reinforced by increasing volume on green candles, pointing to a potential bullish divergence. A recent wick testing $2.14 suggests market appetite is building, though a definitive breakout remains pending. Should the asset break and retest this upper boundary convincingly, a move toward $2.20–$2.25 could materialize, provided volume supports the breakout.
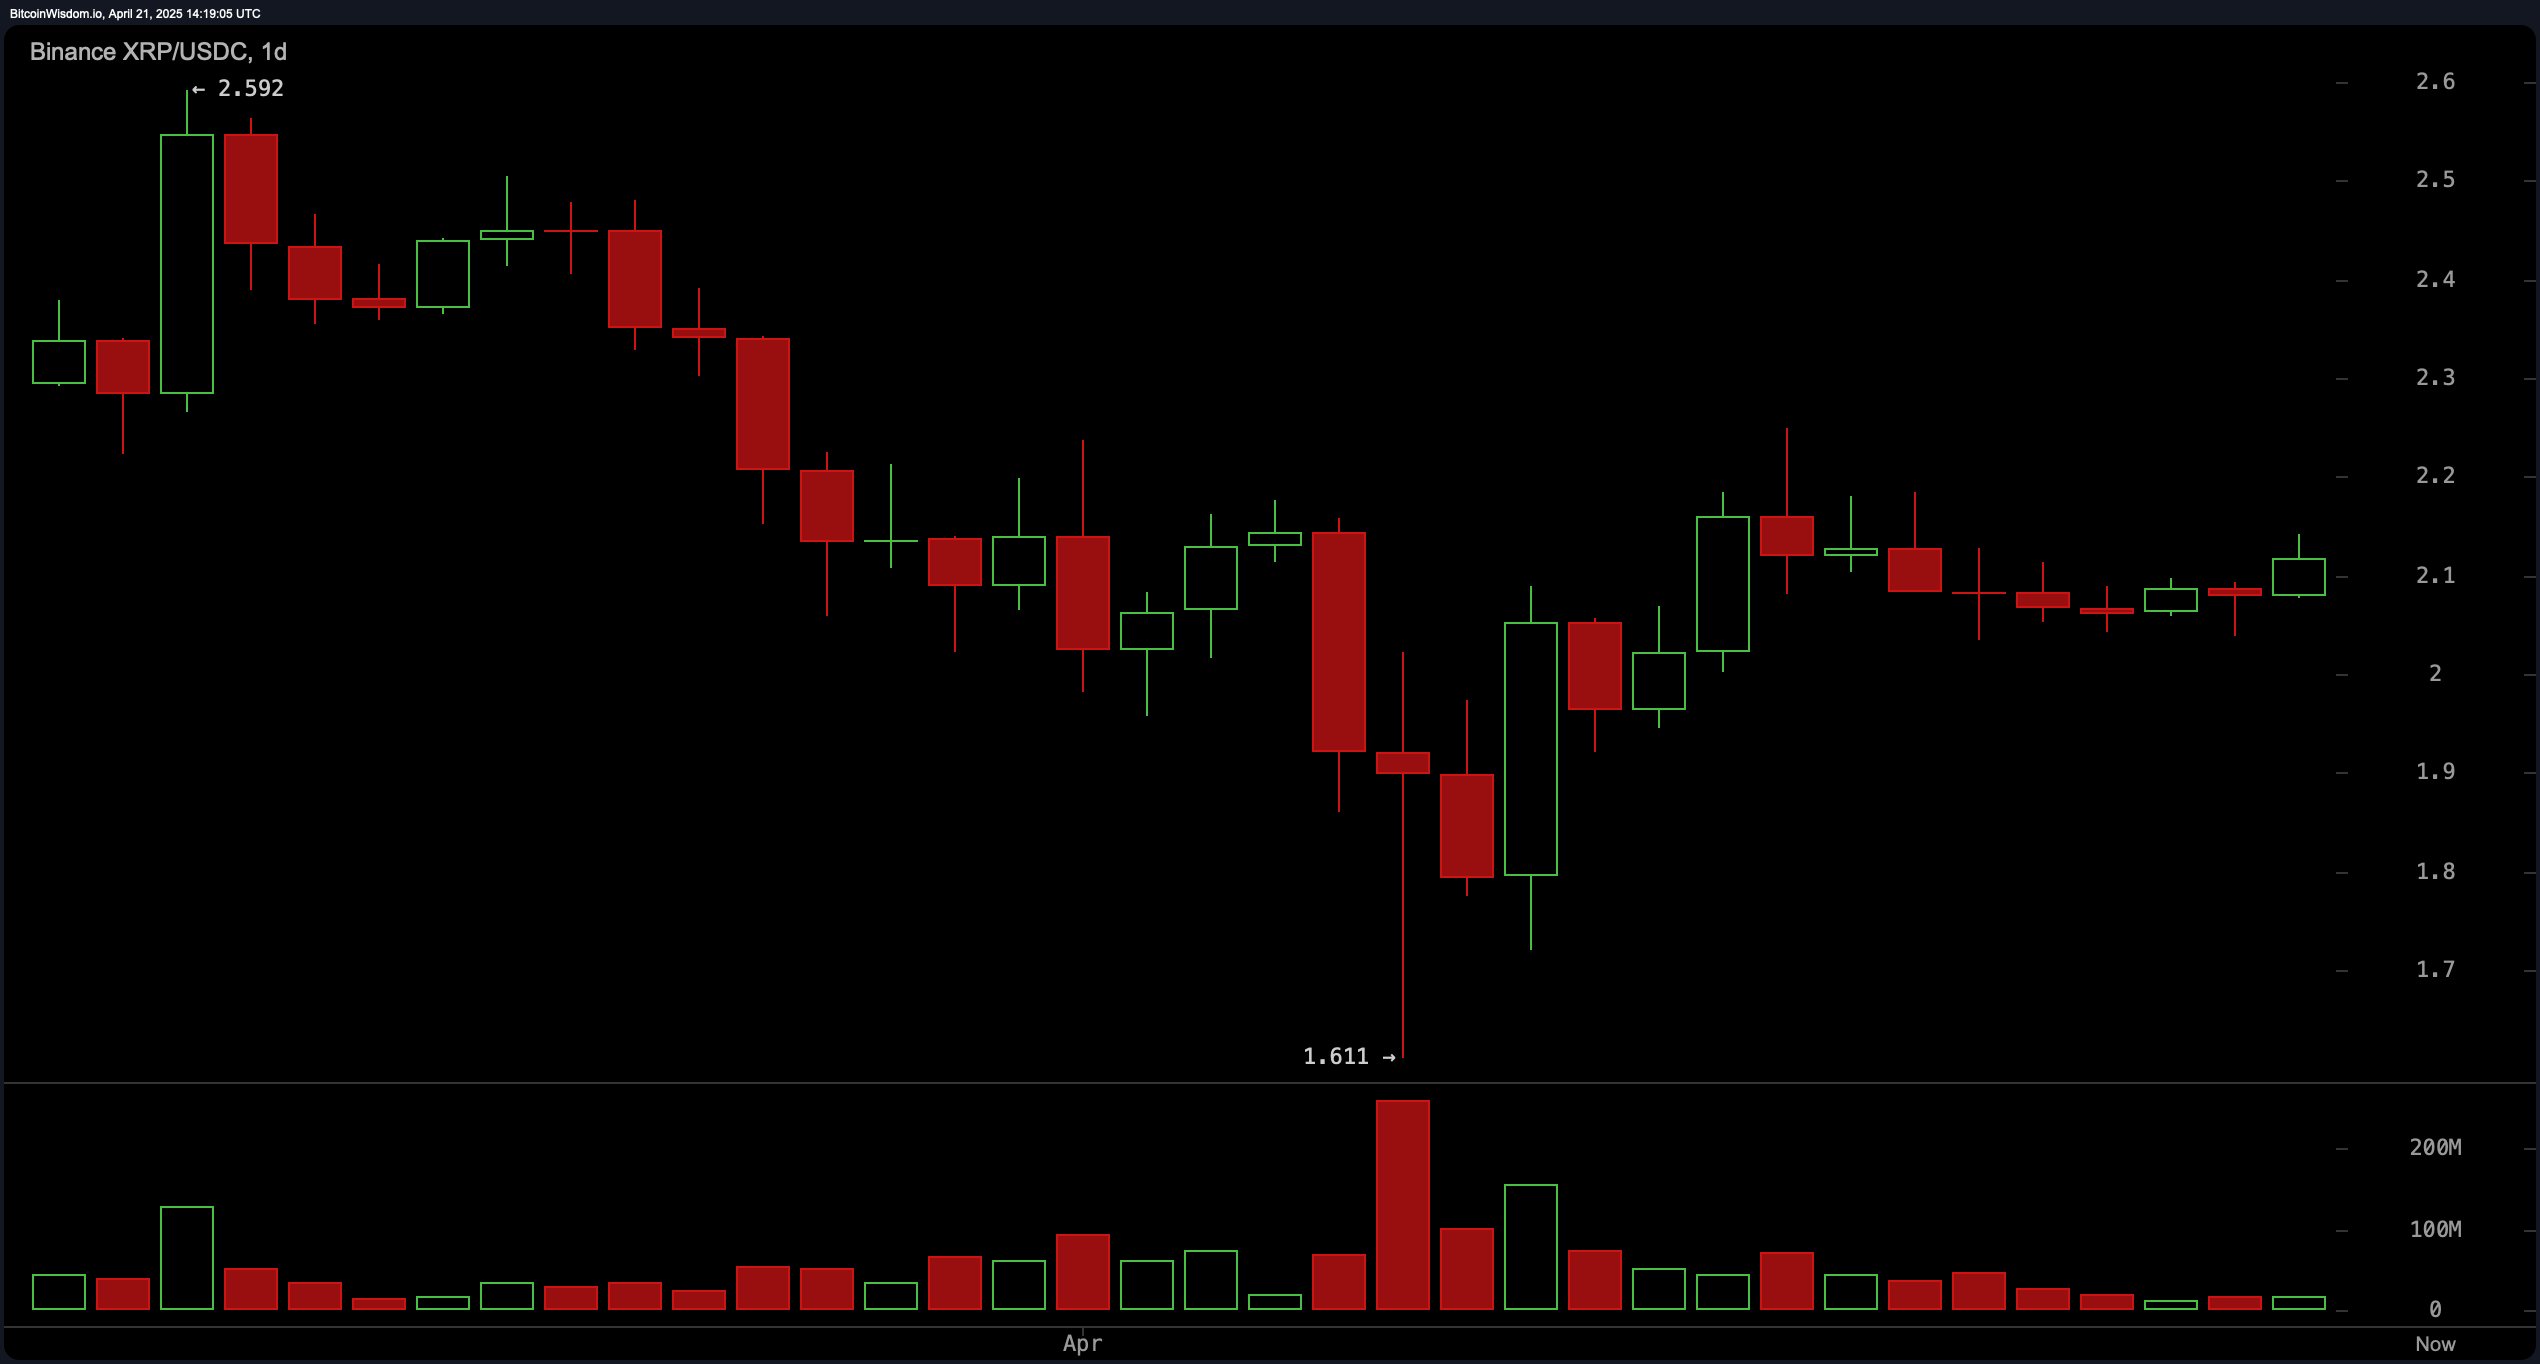
The daily chart presents a broader perspective of a market recovering from its recent downtrend, having rebounded from a significant low of $1.61 after a prolonged bearish phase. XRP is currently trading in a range-bound consolidation between $2.10 and $2.12, suggesting a market in pause, possibly preparing for its next directional move. The support at $1.61 remains structurally significant, while resistance looms in the $2.20–$2.30 band. The price action indicates an accumulation phase, and if the $2.20 resistance is breached with convincing volume, the stage may be set for a more sustained upside.
Among oscillators, the relative strength index ( RSI) stands at 49.84136, the Stochastic at 74.60660, the commodity channel index (CCI) at 59.93883, the average directional index (ADX) at 20.39190, and the Awesome oscillator at −0.08080, all reflecting neutral sentiment. Momentum at 0.09519 suggests a minor negative bias, whereas the moving average convergence divergence ( MACD) level at −0.03369 flashes a bullish signal, highlighting market indecision with potential for direction once confirmation arrives.
Moving averages provide a nuanced picture: the 10-period exponential moving average (EMA) at $2.08240 and simple moving average (SMA) at $2.09834 signal positivity, as do the 20-period EMA and SMA. However, the 30-, 50-, and 100-period EMAs and SMAs all register bearish signals, suggesting mid-term negative overhang. Notably, the 200-period EMA and SMA, at $1.96321 and $1.94896, respectively, both signal bullishness—implying that long-term trend momentum remains constructive despite short-term volatility. This layered divergence across timeframes emphasizes the importance of volume as the next catalyst for directional clarity.
Bull Verdict:
If XRP maintains support above $2.10 and breaks through $2.14 with conviction and volume, the bullish flag on the 1-hour chart and ascending structure on the 4-hour chart could confirm a push toward $2.20–$2.30. Reinforced by long-term moving averages flashing buy signals, a sustained uptrend remains firmly on the table, especially if accumulation continues and market sentiment improves.
Bear Verdict:
Failure to hold the $2.10–$2.11 support zone could unravel the short-term bullish setup, opening the door to a retest of lower support near $2.05 or even $2.00. With mid-term moving averages still tilted bearish and oscillators largely neutral, XRP could slip into a corrective phase if buying momentum fails to materialize at current levels.