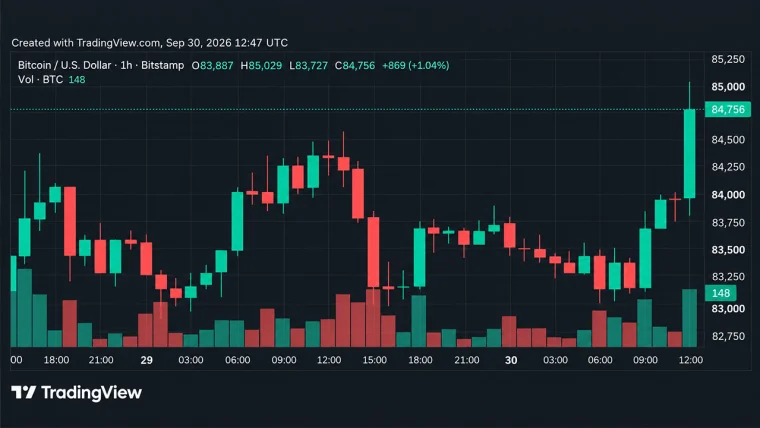



Bitcoin’s price stands at a lofty $89,995 to $90,094 over the past hour, capping a range-bound 24-hour session with a market cap of around $1.79 trillion. Trading volume clocked in at a robust $32.98 billion, as prices oscillated between $87,655 and $90,353. The digital heavyweight may not have burst through new all-time highs, but it’s clearly flexing muscle within its current battleground.
Scaling the Crypto Heights: Bitcoin Sets Sights on $95K and Beyond

This article was published more than a month ago. Some information may no longer be current.
WRITTEN BY

SHARE

Bitcoin Chart Outlook
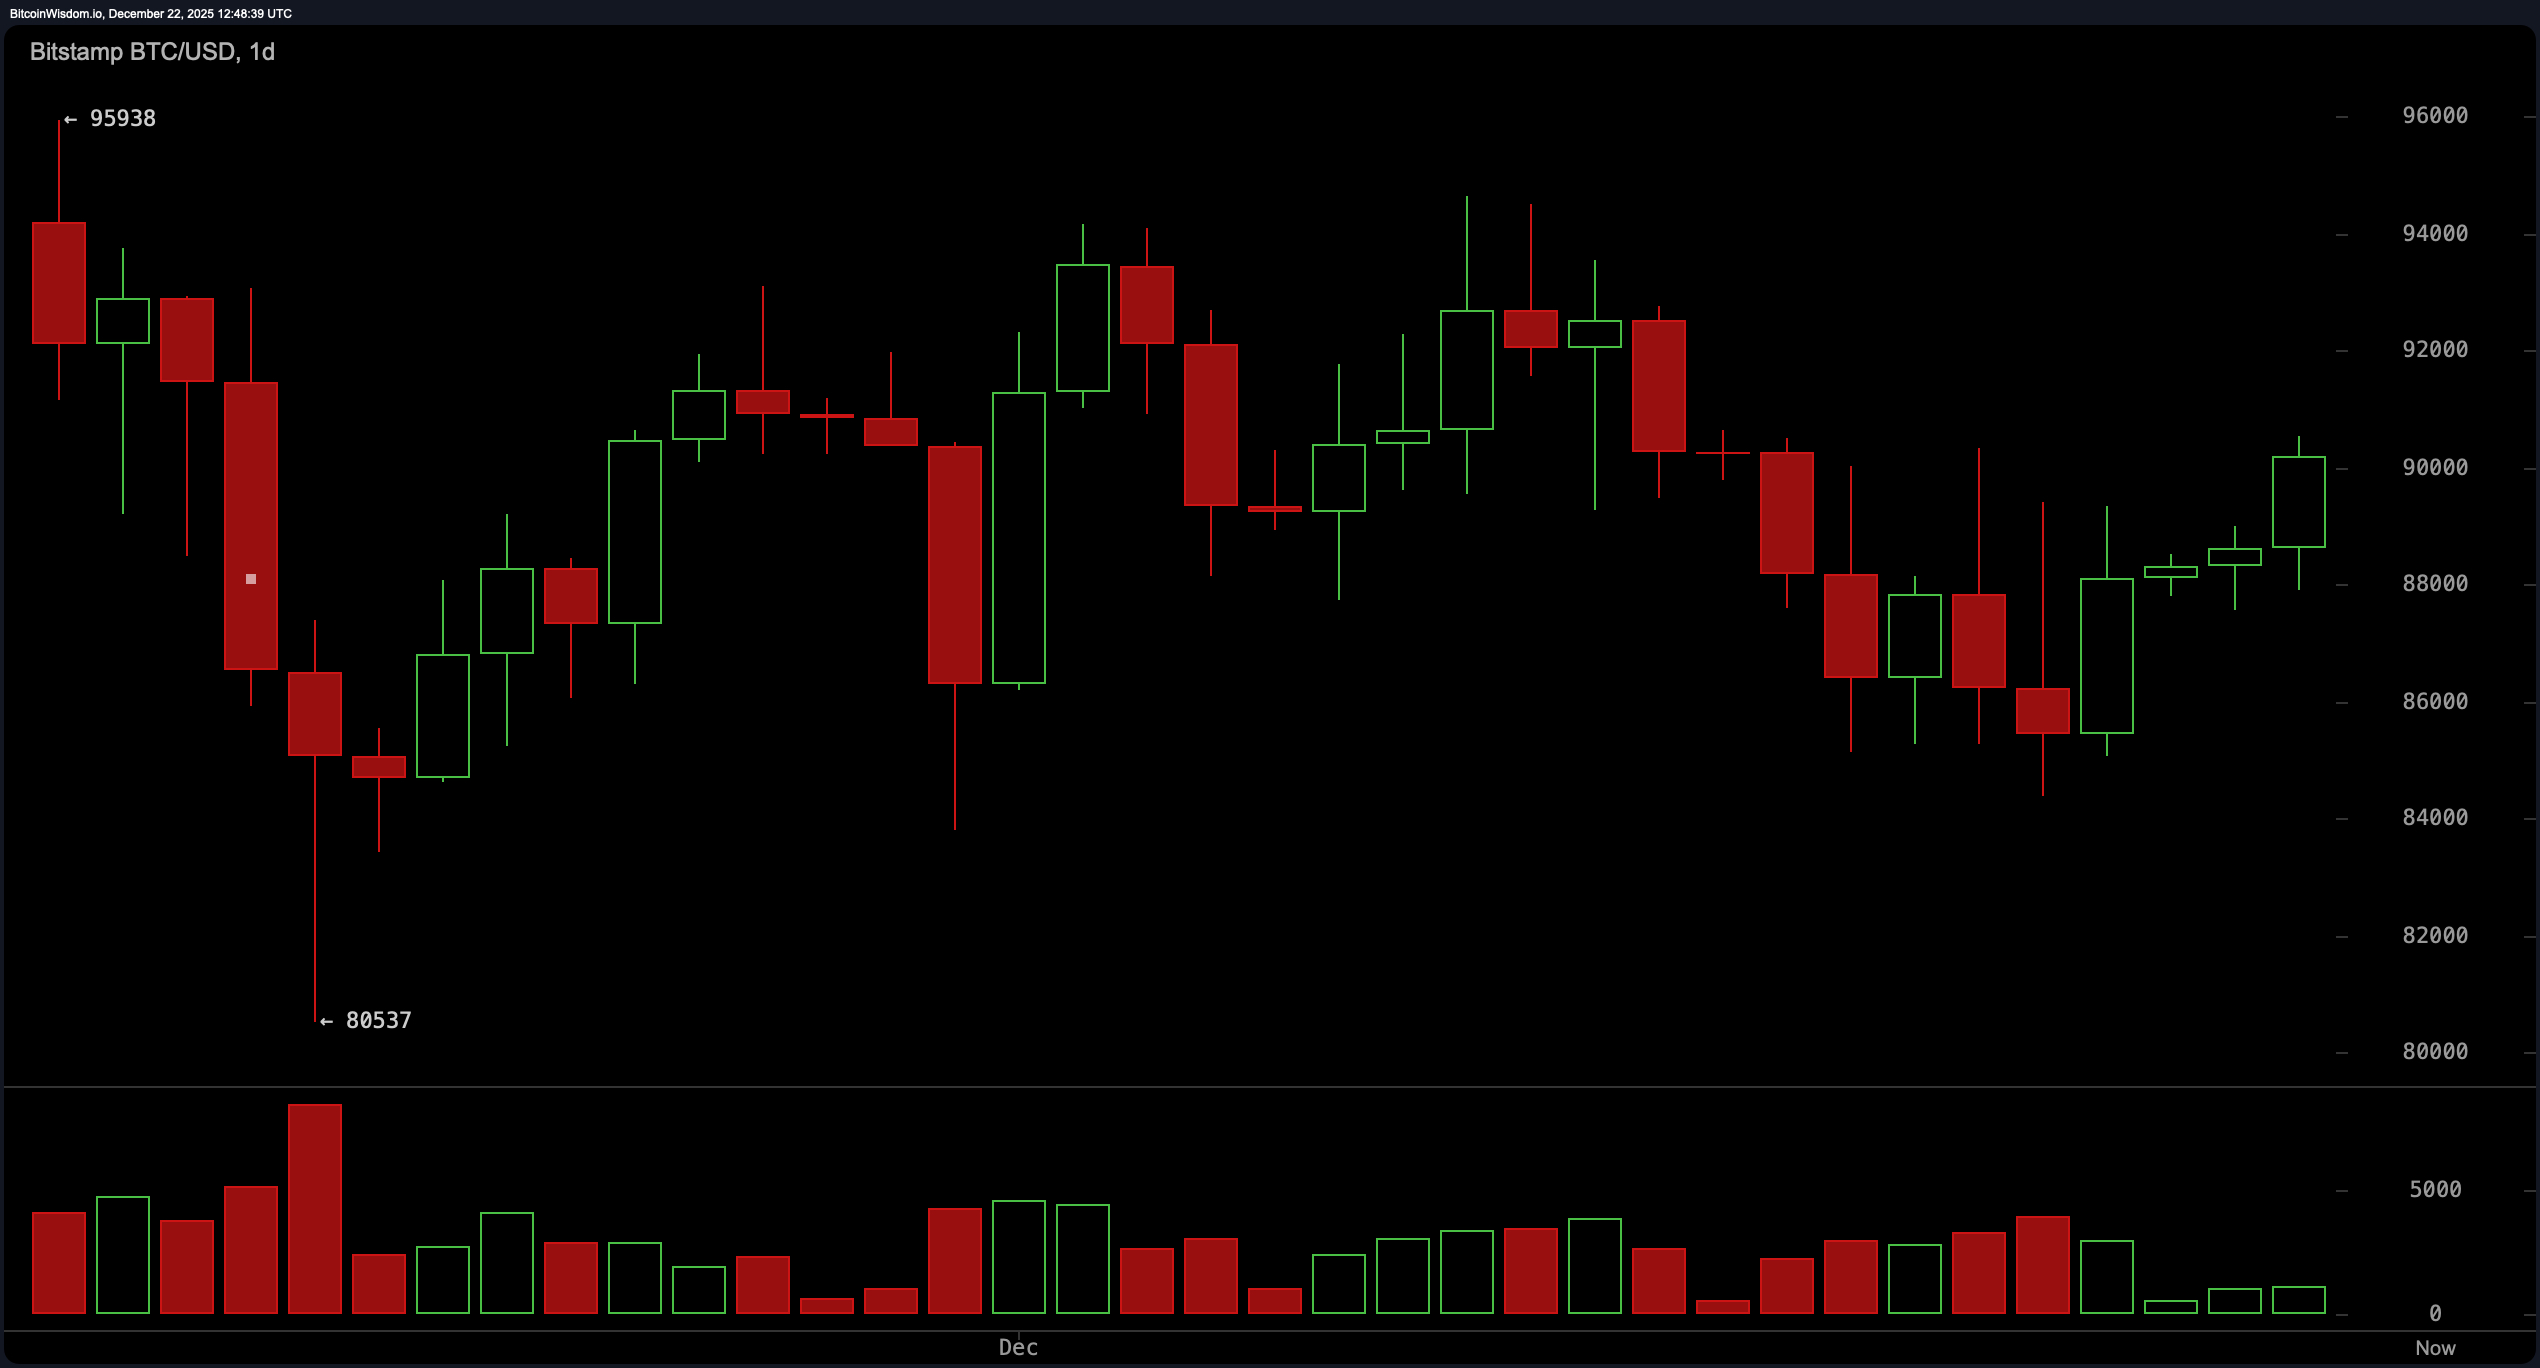
The daily chart paints a picture of calculated optimism. After shaking off a nosedive to the $80,537 low, bitcoin is now consolidating in a comeback arc. A succession of green candlesticks with upper wicks reflects buyers showing up—but with just enough hesitation to keep the $91,000 resistance intact.
Momentum is building, albeit at a cautious pace, and an uptick in volume suggests that institutional players are quietly refueling their rockets. Should bitcoin secure a solid daily close above $91,000, the door creaks open toward the $95,000–$96,000 corridor.
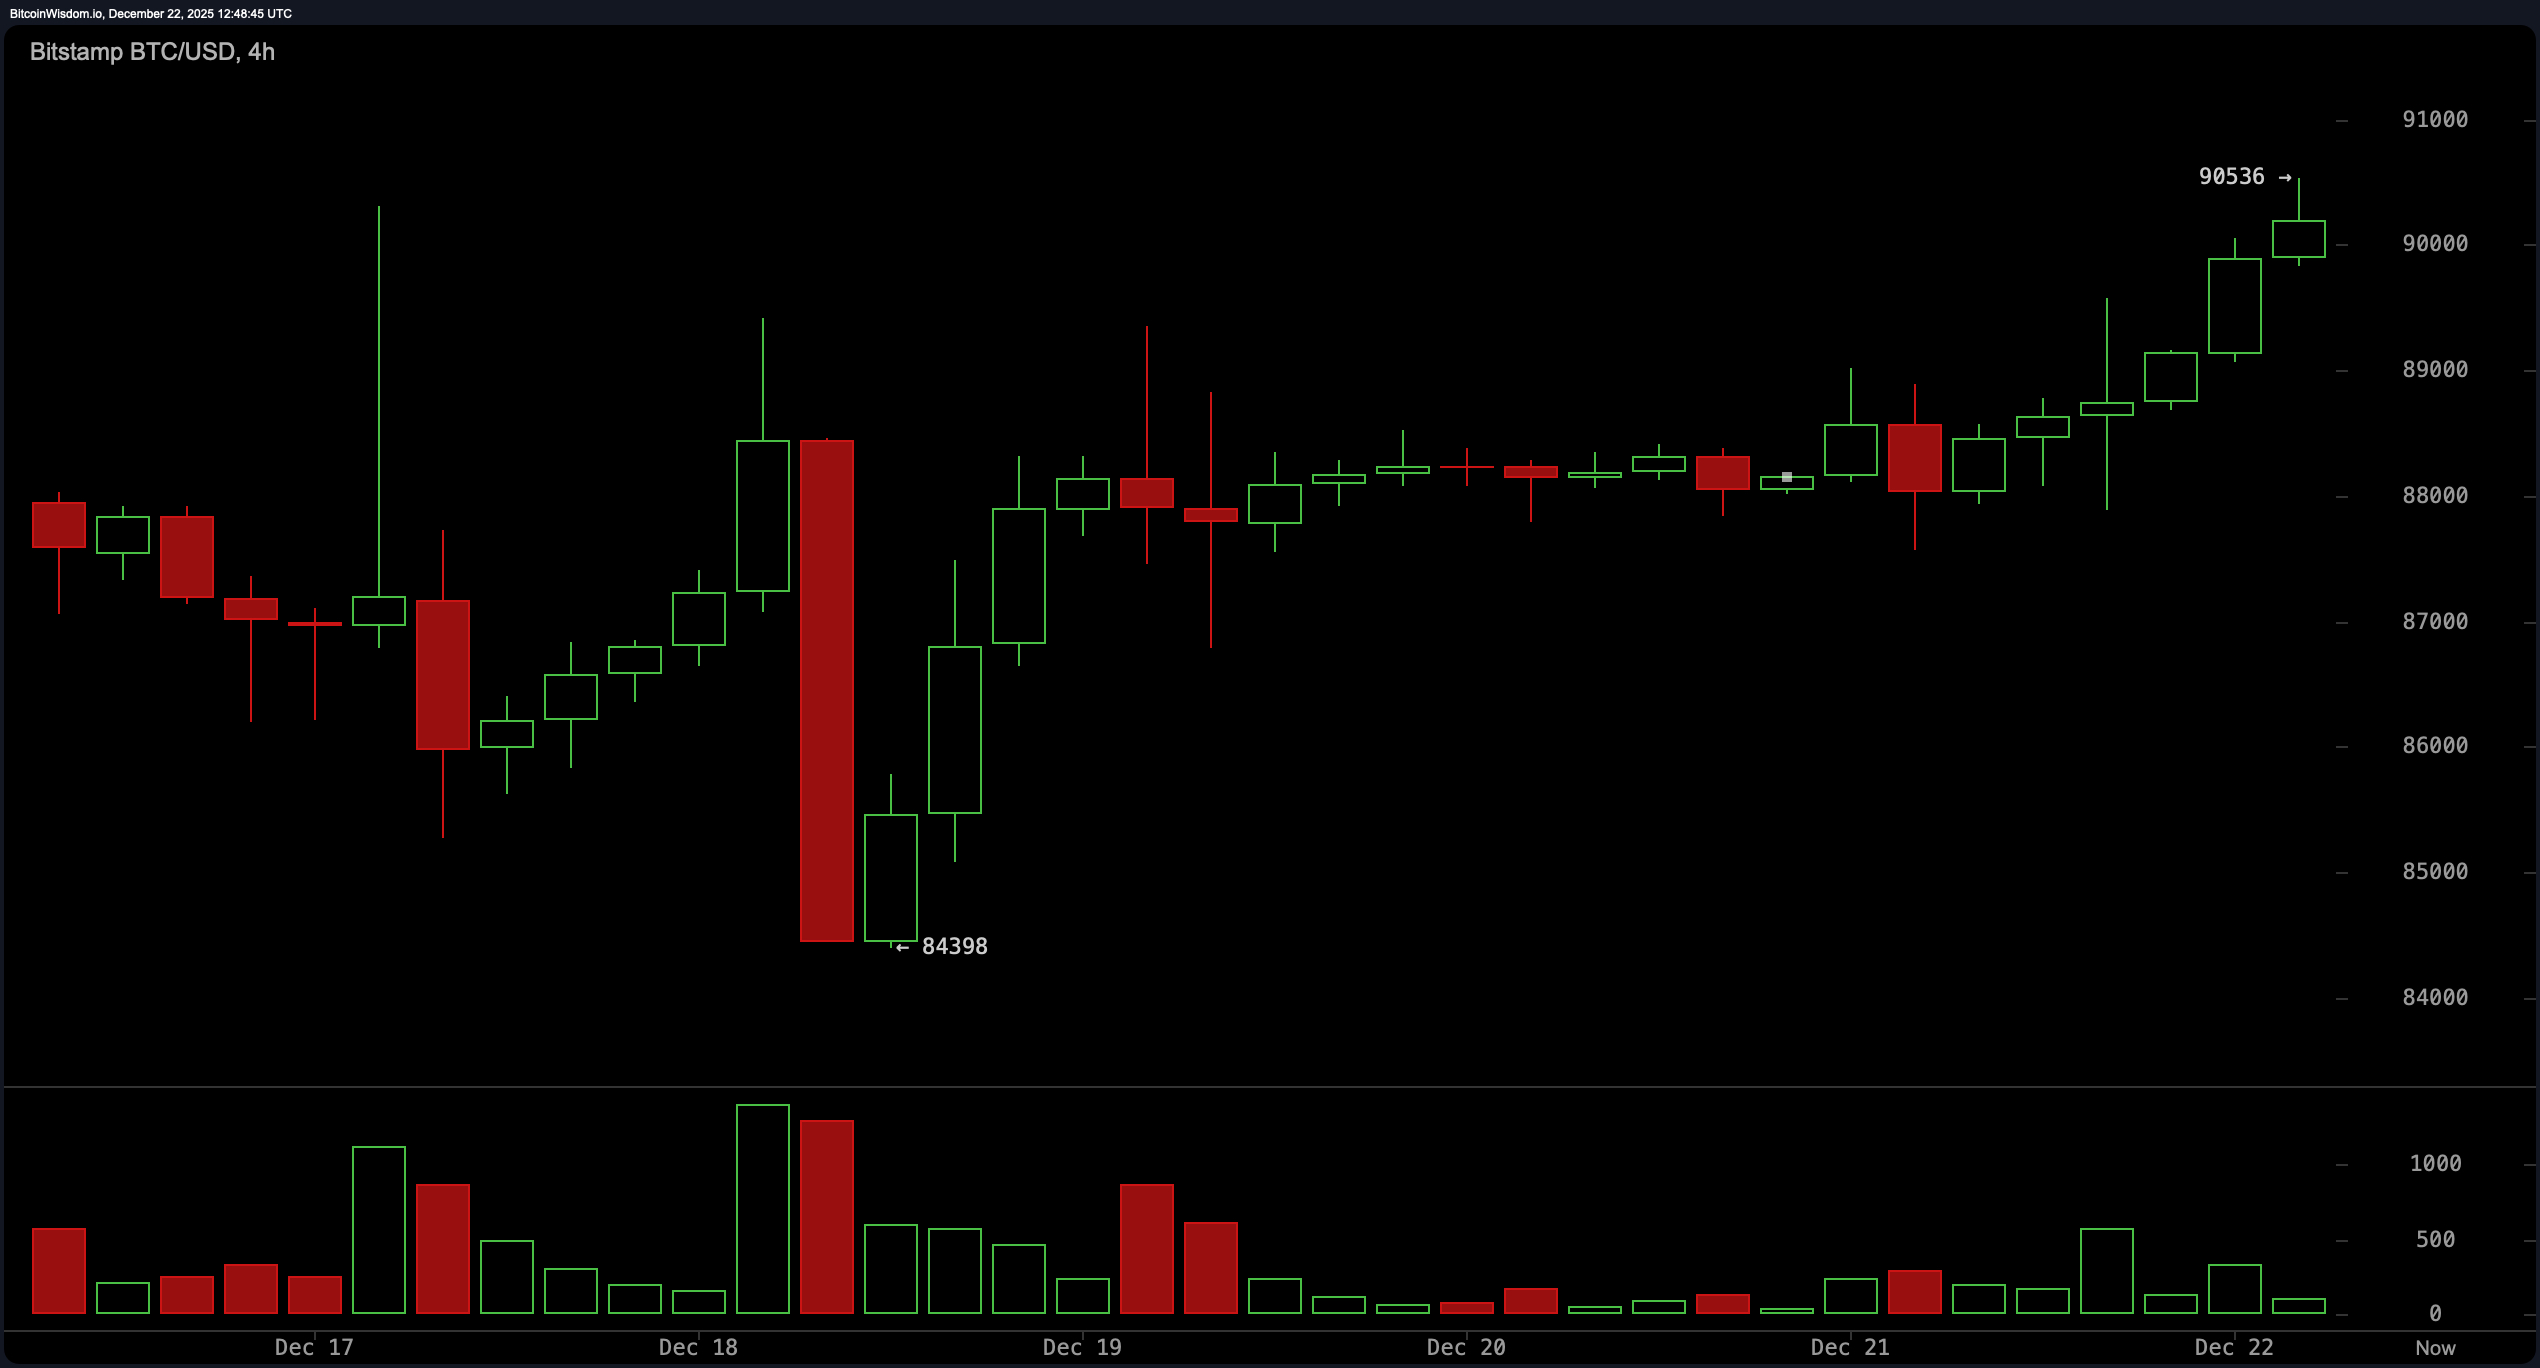
Zooming into the 4-hour chart, the medium-term trajectory tilts bullish with classic higher highs and higher lows defining structure. The price pivoted dramatically from around $84,398, climbing toward $90,536 on surging volume—a telltale sign that whales aren’t just watching, they’re swimming. The current consolidation band between $86,500 and $89,000 is acting as a launchpad. An intrachart revisit to the $89,000–$89,500 zone could offer reentry prospects, so long as price maintains altitude above $87,000.
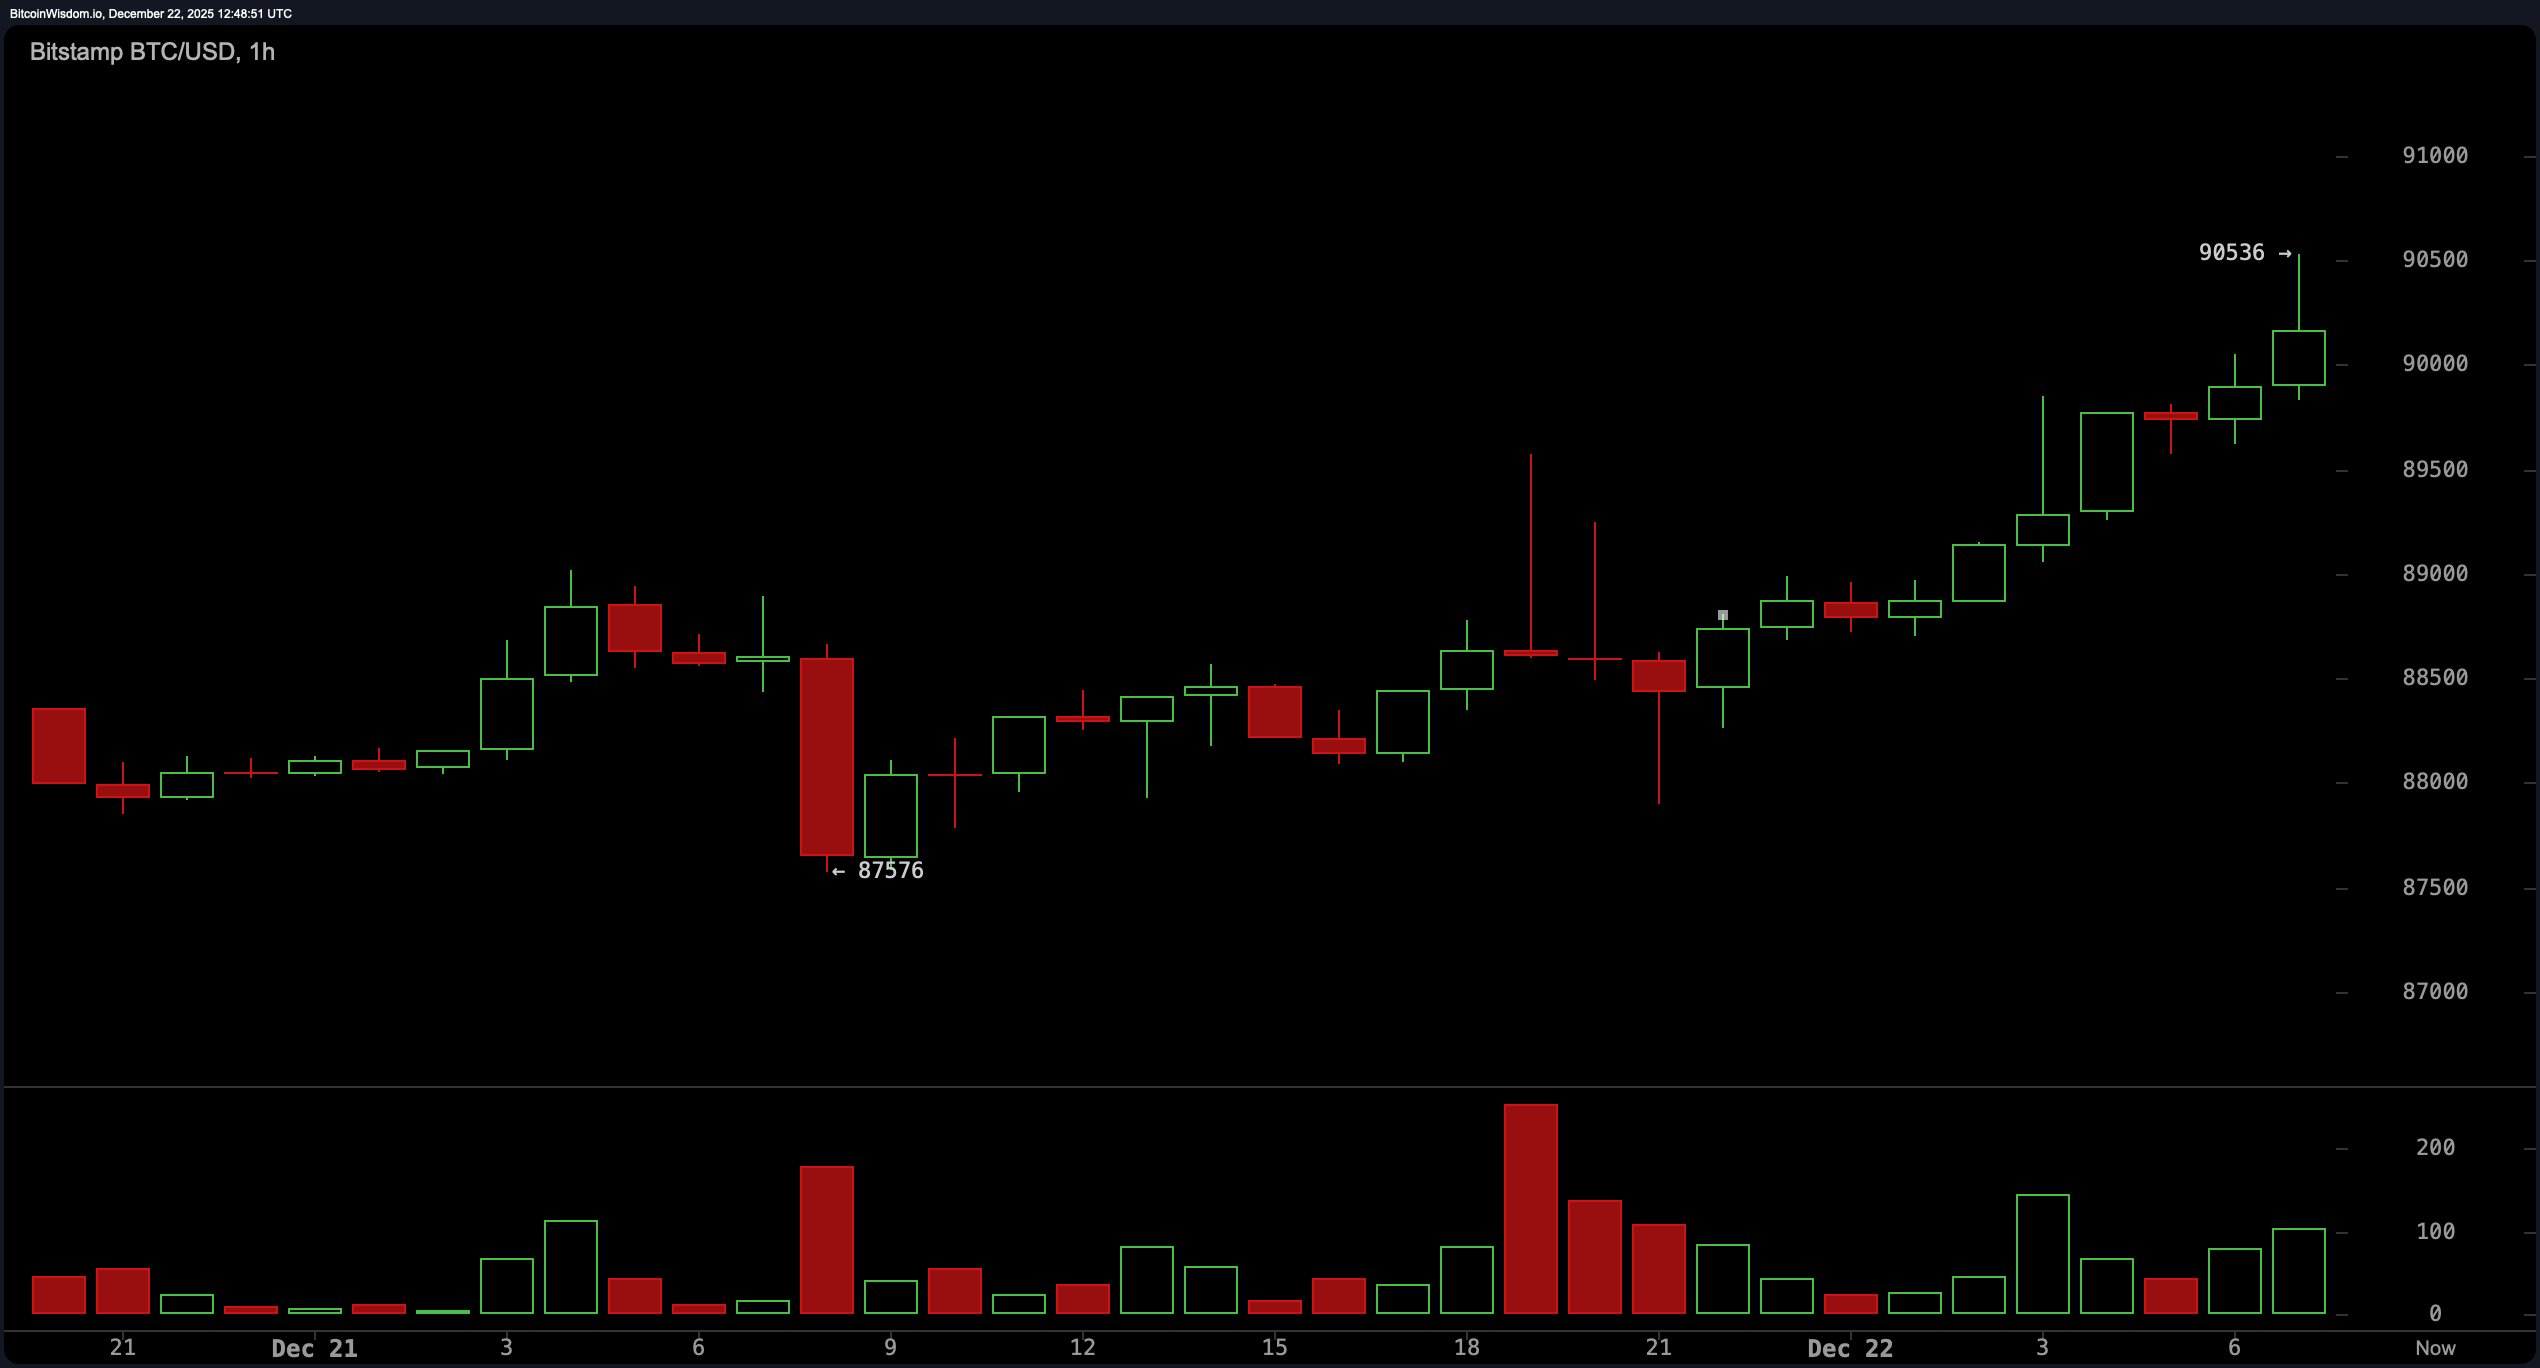
At the 1-hour level, it’s all green lights and full throttle. The breakout has been decisive, with $90,536 showing up as the recent peak. Increased volume on the way up solidifies this short-term bullish streak. The $88,500–$89,000 region, once resistance, has turned into a comfy support hammock. If there’s a minor pullback toward $89,500–$90,000 with weak selling pressure, that may just be a pit stop before the next leg higher.
Now let’s talk indicators. Oscillators are playing it cool across the board, with the relative strength index (RSI) holding steady at 50, the Stochastic oscillator lounging at 45, and the commodity channel index (CCI) barely budging at -8—all signaling neutrality. The average directional index (ADX) reads 24, indicating a trend that’s still stretching its legs. But if you’re looking for some bullish cheerleaders, look no further than momentum at -216 and the moving average convergence divergence (MACD) at -1,325—both suggesting some forward thrust behind the scenes.
Moving averages (MAs), however, are serving up a mixed cocktail. Short-term lines like the exponential moving average (EMA) 10 at $88,605 and simple moving average (SMA) 10 at $87,947 are nudging upward. The mid-range 30-period EMA, perched at $90,574, throws in a mild contrarian vibe. Yet, the heavyweight long-term averages like the EMA 200 and SMA 200—far above the current price at $102,001 and $107,885, respectively—suggest bitcoin still has mountains to climb before calling itself fully recovered. Translation: we’re in a tug-of-war between near-term strength and long-term hesitation.
Bull Verdict:
With rising momentum, institutional-sized volume spikes, and a fierce hold above critical support zones, bitcoin appears locked and loaded for a breakout. A confirmed move above the $91,000 resistance could unleash a rally toward $95,000–$96,000, reigniting the bull flame that’s been flickering since the $80K dip. For now, the bulls are in the driver’s seat—seatbelts optional.
Bear Verdict:
Despite a strong recovery, bitcoin is still boxed below the $91,000 resistance and facing headwinds from long-term moving averages. Neutral oscillators and a narrowing price range hint at waning conviction. Without a decisive breakout, this could all be smoke before the next slide—especially if volume fizzles or $89,000 support caves in.
FAQ ❓
- What is bitcoin’s price today?
Bitcoin is trading at $90,094 as of Dec. 22, 2025. - Where is bitcoin’s key resistance level now?
The $91,000 zone is the critical resistance across all timeframes. - What support levels should traders watch?
Key support lies between $88,500 and $89,000 short-term, and $85,000 longer-term. - Is bitcoin showing bullish or bearish signals?
Technical indicators and price structure lean bullish, but resistance remains unbroken.