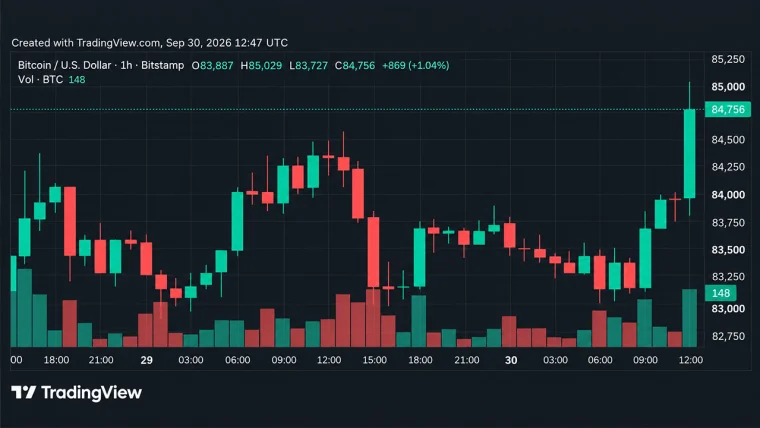



Bitcoin is trading at $65,419, wedged between fading macro momentum and a short-term squeeze attempt that refuses to quit. The charts are aligned in classic relief-rally fashion — and the technicals are serving tension with a side of volatility.
Relief Rally or Lower High? Bitcoin Tests Critical Resistance at $64K–$67K

This article was published more than a month ago. Some information may no longer be current.
WRITTEN BY

SHARE

Bitcoin Chart Outlook
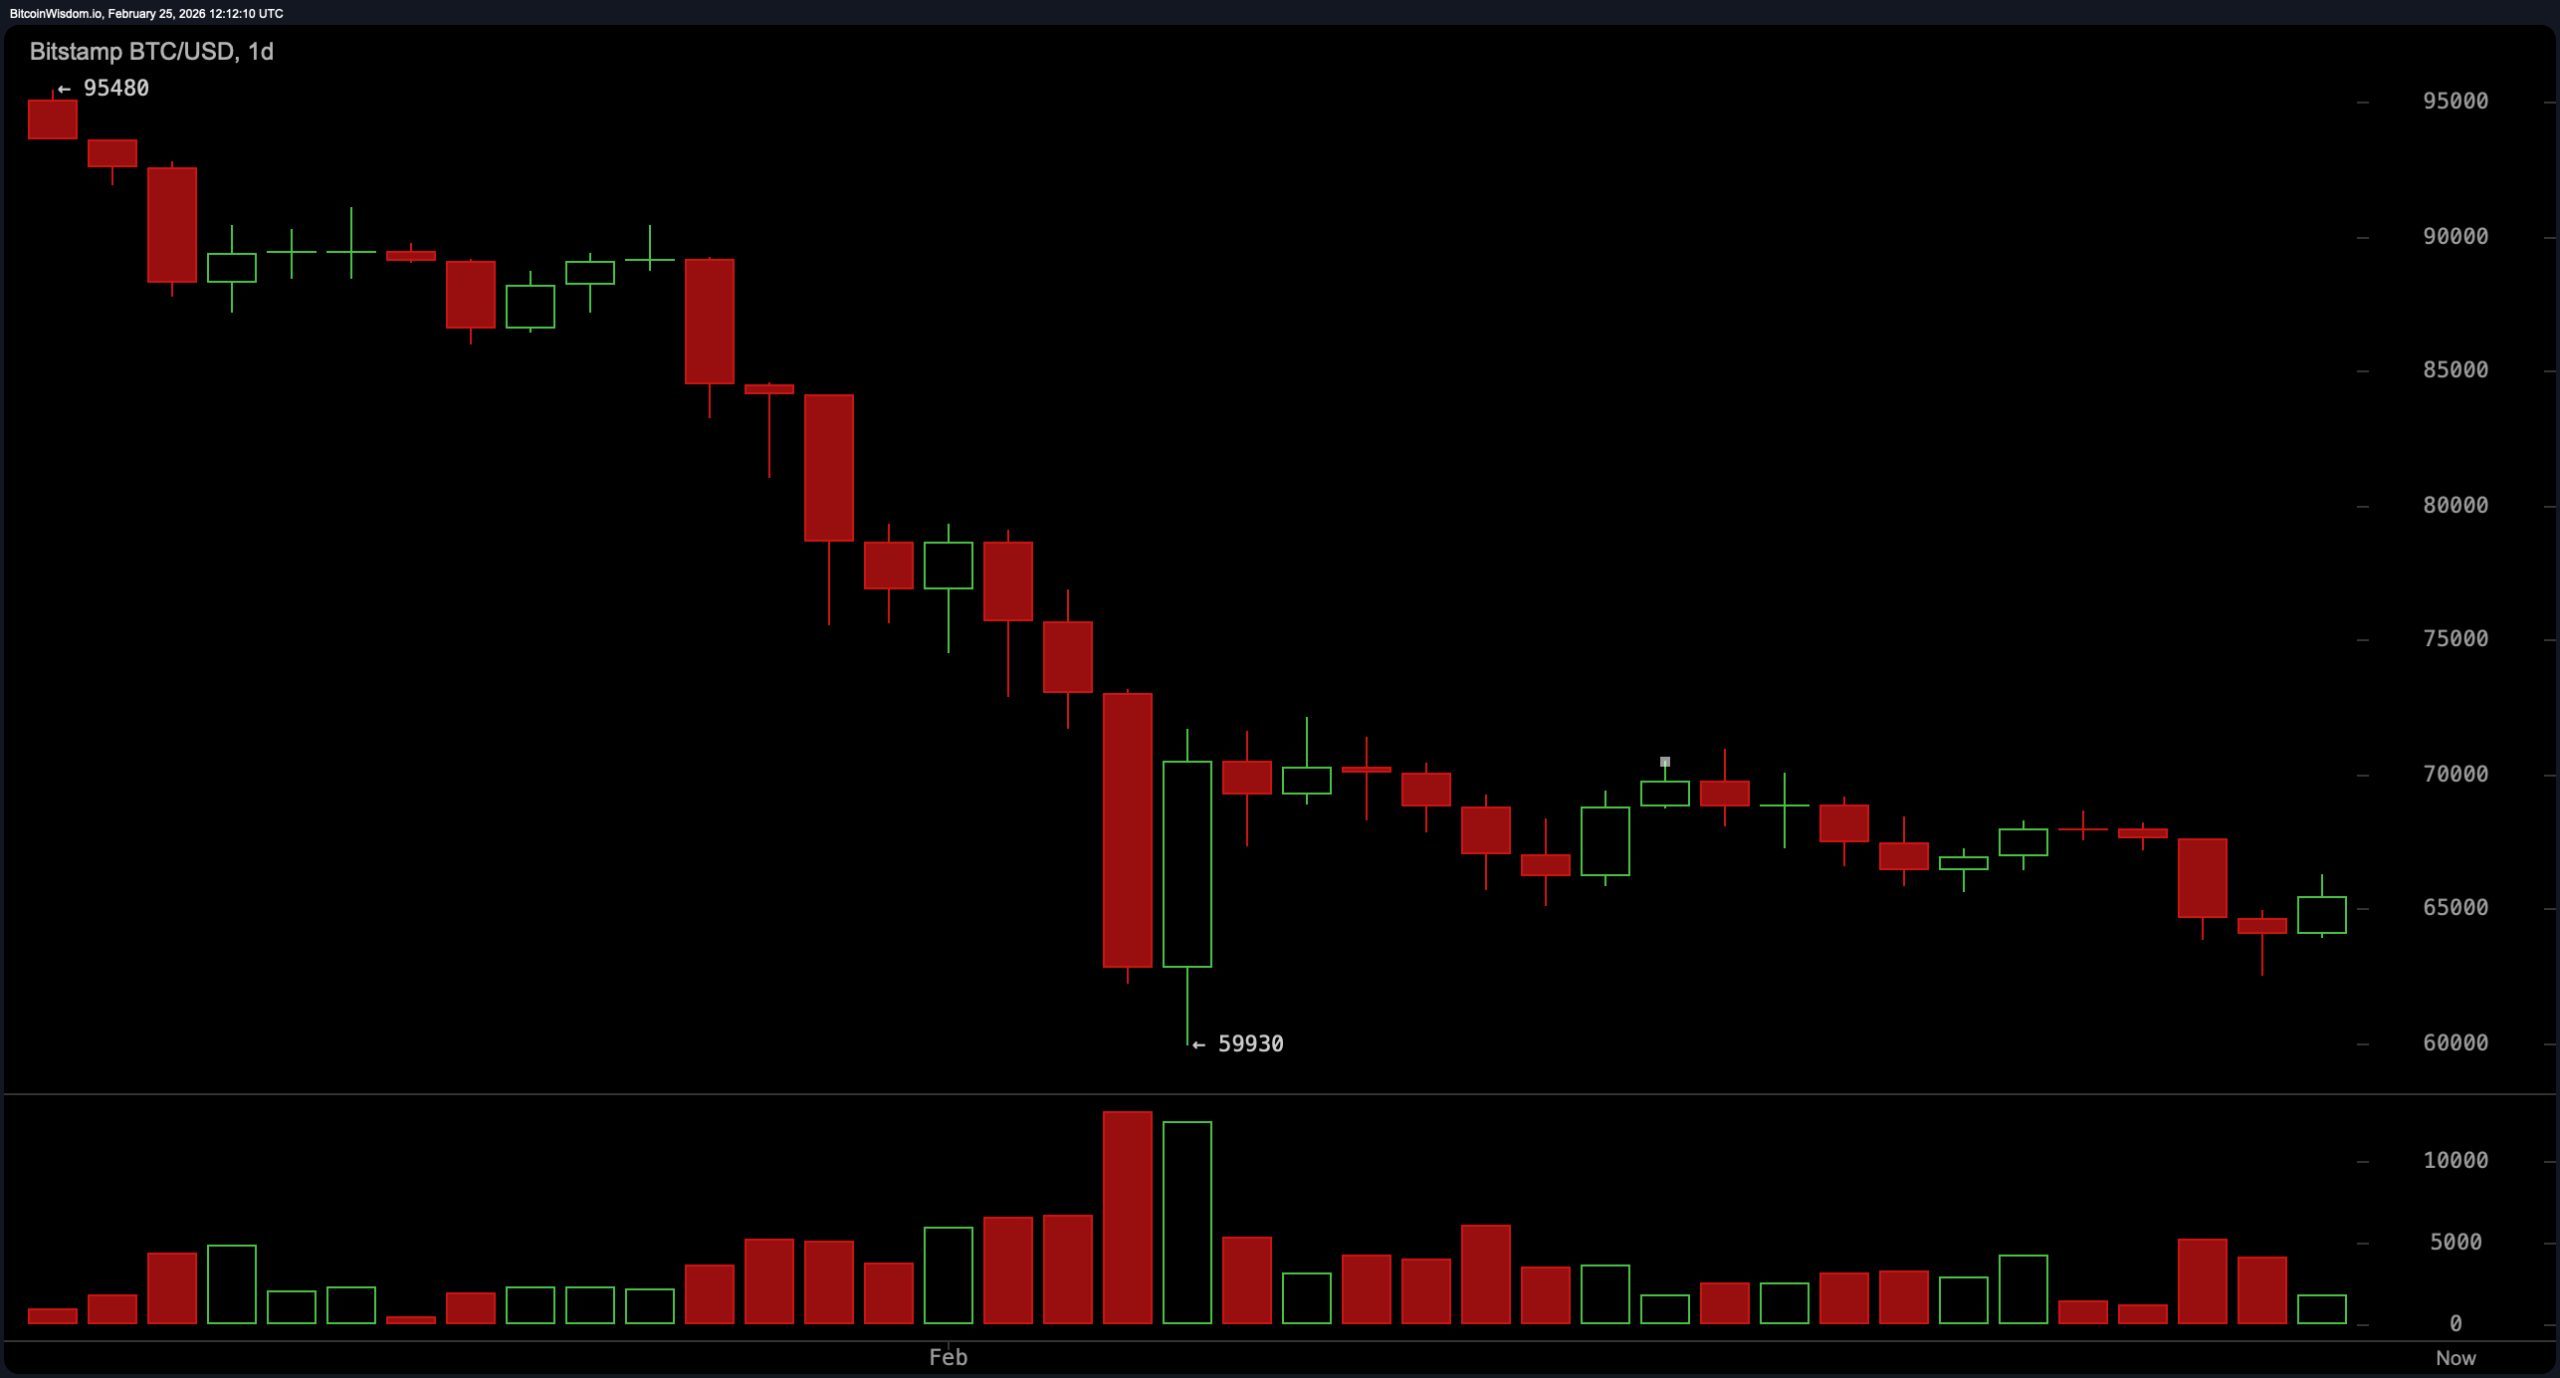
Bitcoin’s daily chart paints the broader structure in unmistakable strokes. Bitcoin has declined from roughly $95,000 to a capitulation low near $59,900, printing a heavy-volume flush before stabilizing in the $64,000 to $66,000 region. That stabilization, however, remains corrective within a prevailing downtrend.
Key support rests at $59,900 to $60,000, with mid-range demand at $62,000 to $63,000. Resistance is layered at $68,000 to $70,000, followed by major resistance at $72,000 to $75,000. Unless price reclaims and sustains acceptance above $70,000 on a daily closing basis, the macro structure remains bearish, with the current move resembling a relief bounce forming a potential lower high.
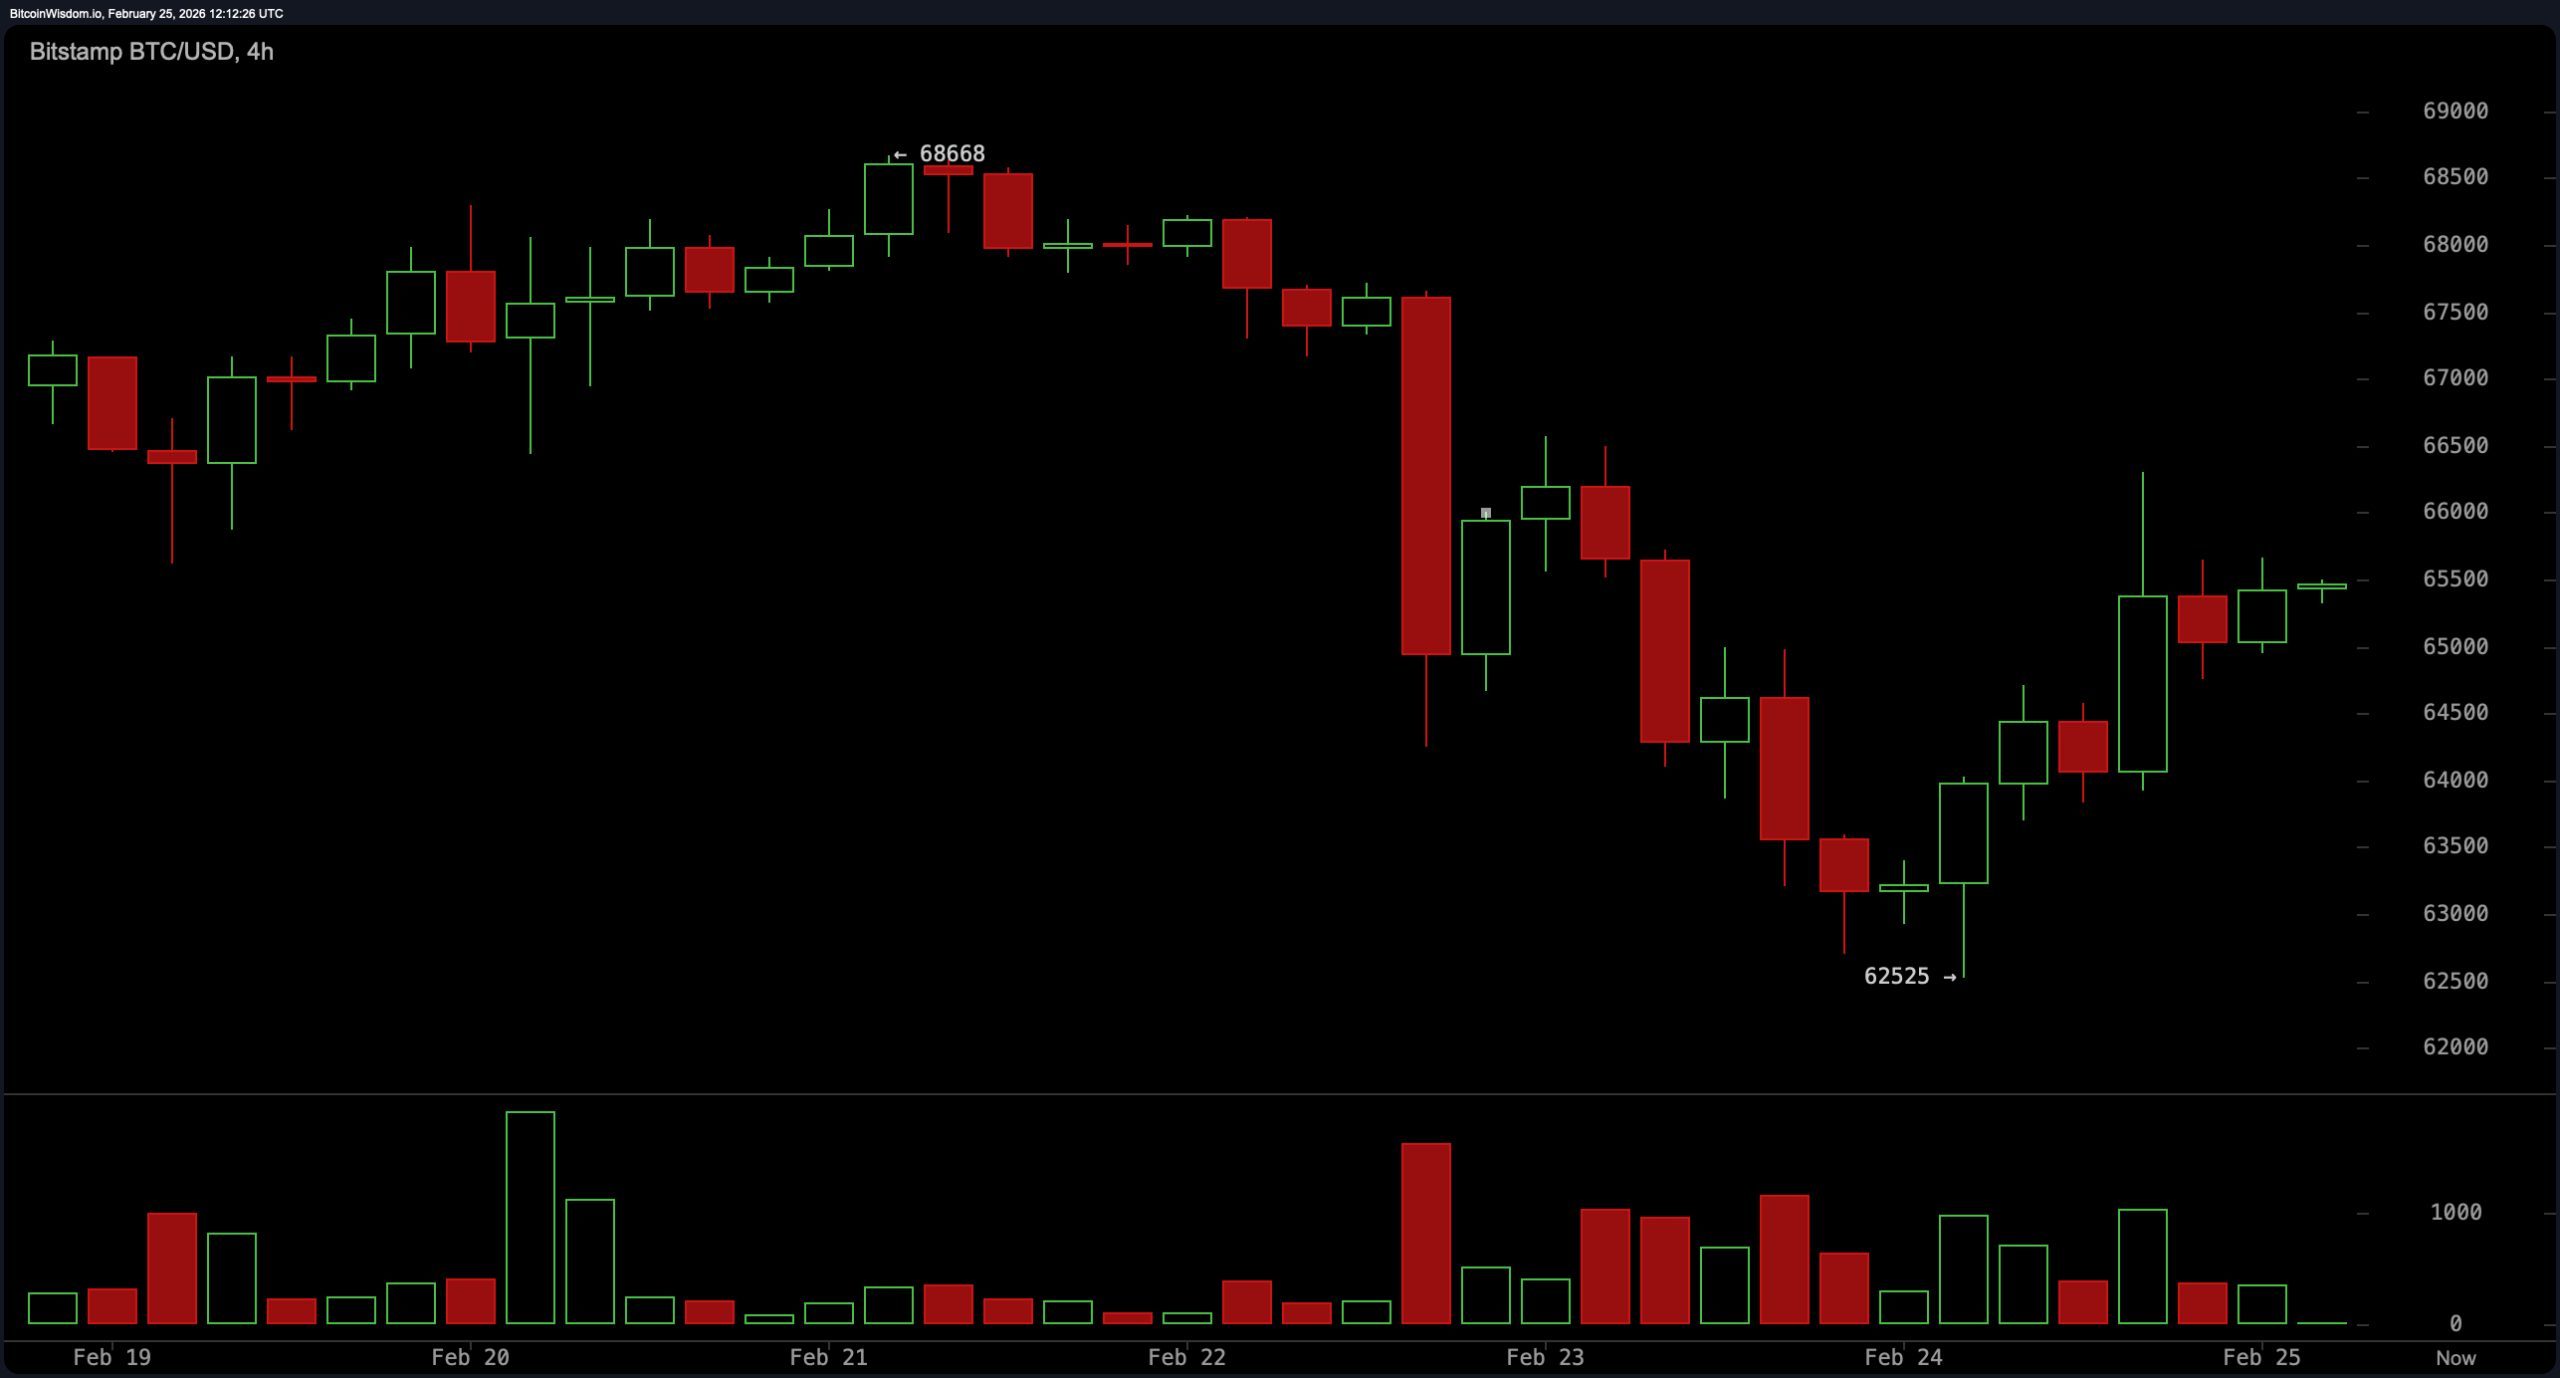
On the four-hour chart, momentum tells a more nuanced story. After falling from $68,600 to $62,500, bitcoin staged a V-shaped rebound and is now forming higher lows on the intraday structure. Immediate resistance sits at $66,800 to $68,000, while support holds at $63,000 to $64,000. A breakdown level remains clearly defined at $62,500. If price clears and holds above $68,000, continuation toward $70,000 becomes structurally plausible. Failure in the $66,000 to $68,000 zone would likely confirm a lower high and open the door for a retest of $62,000 to $63,000 — a scenario that aligns more comfortably with the daily trend.
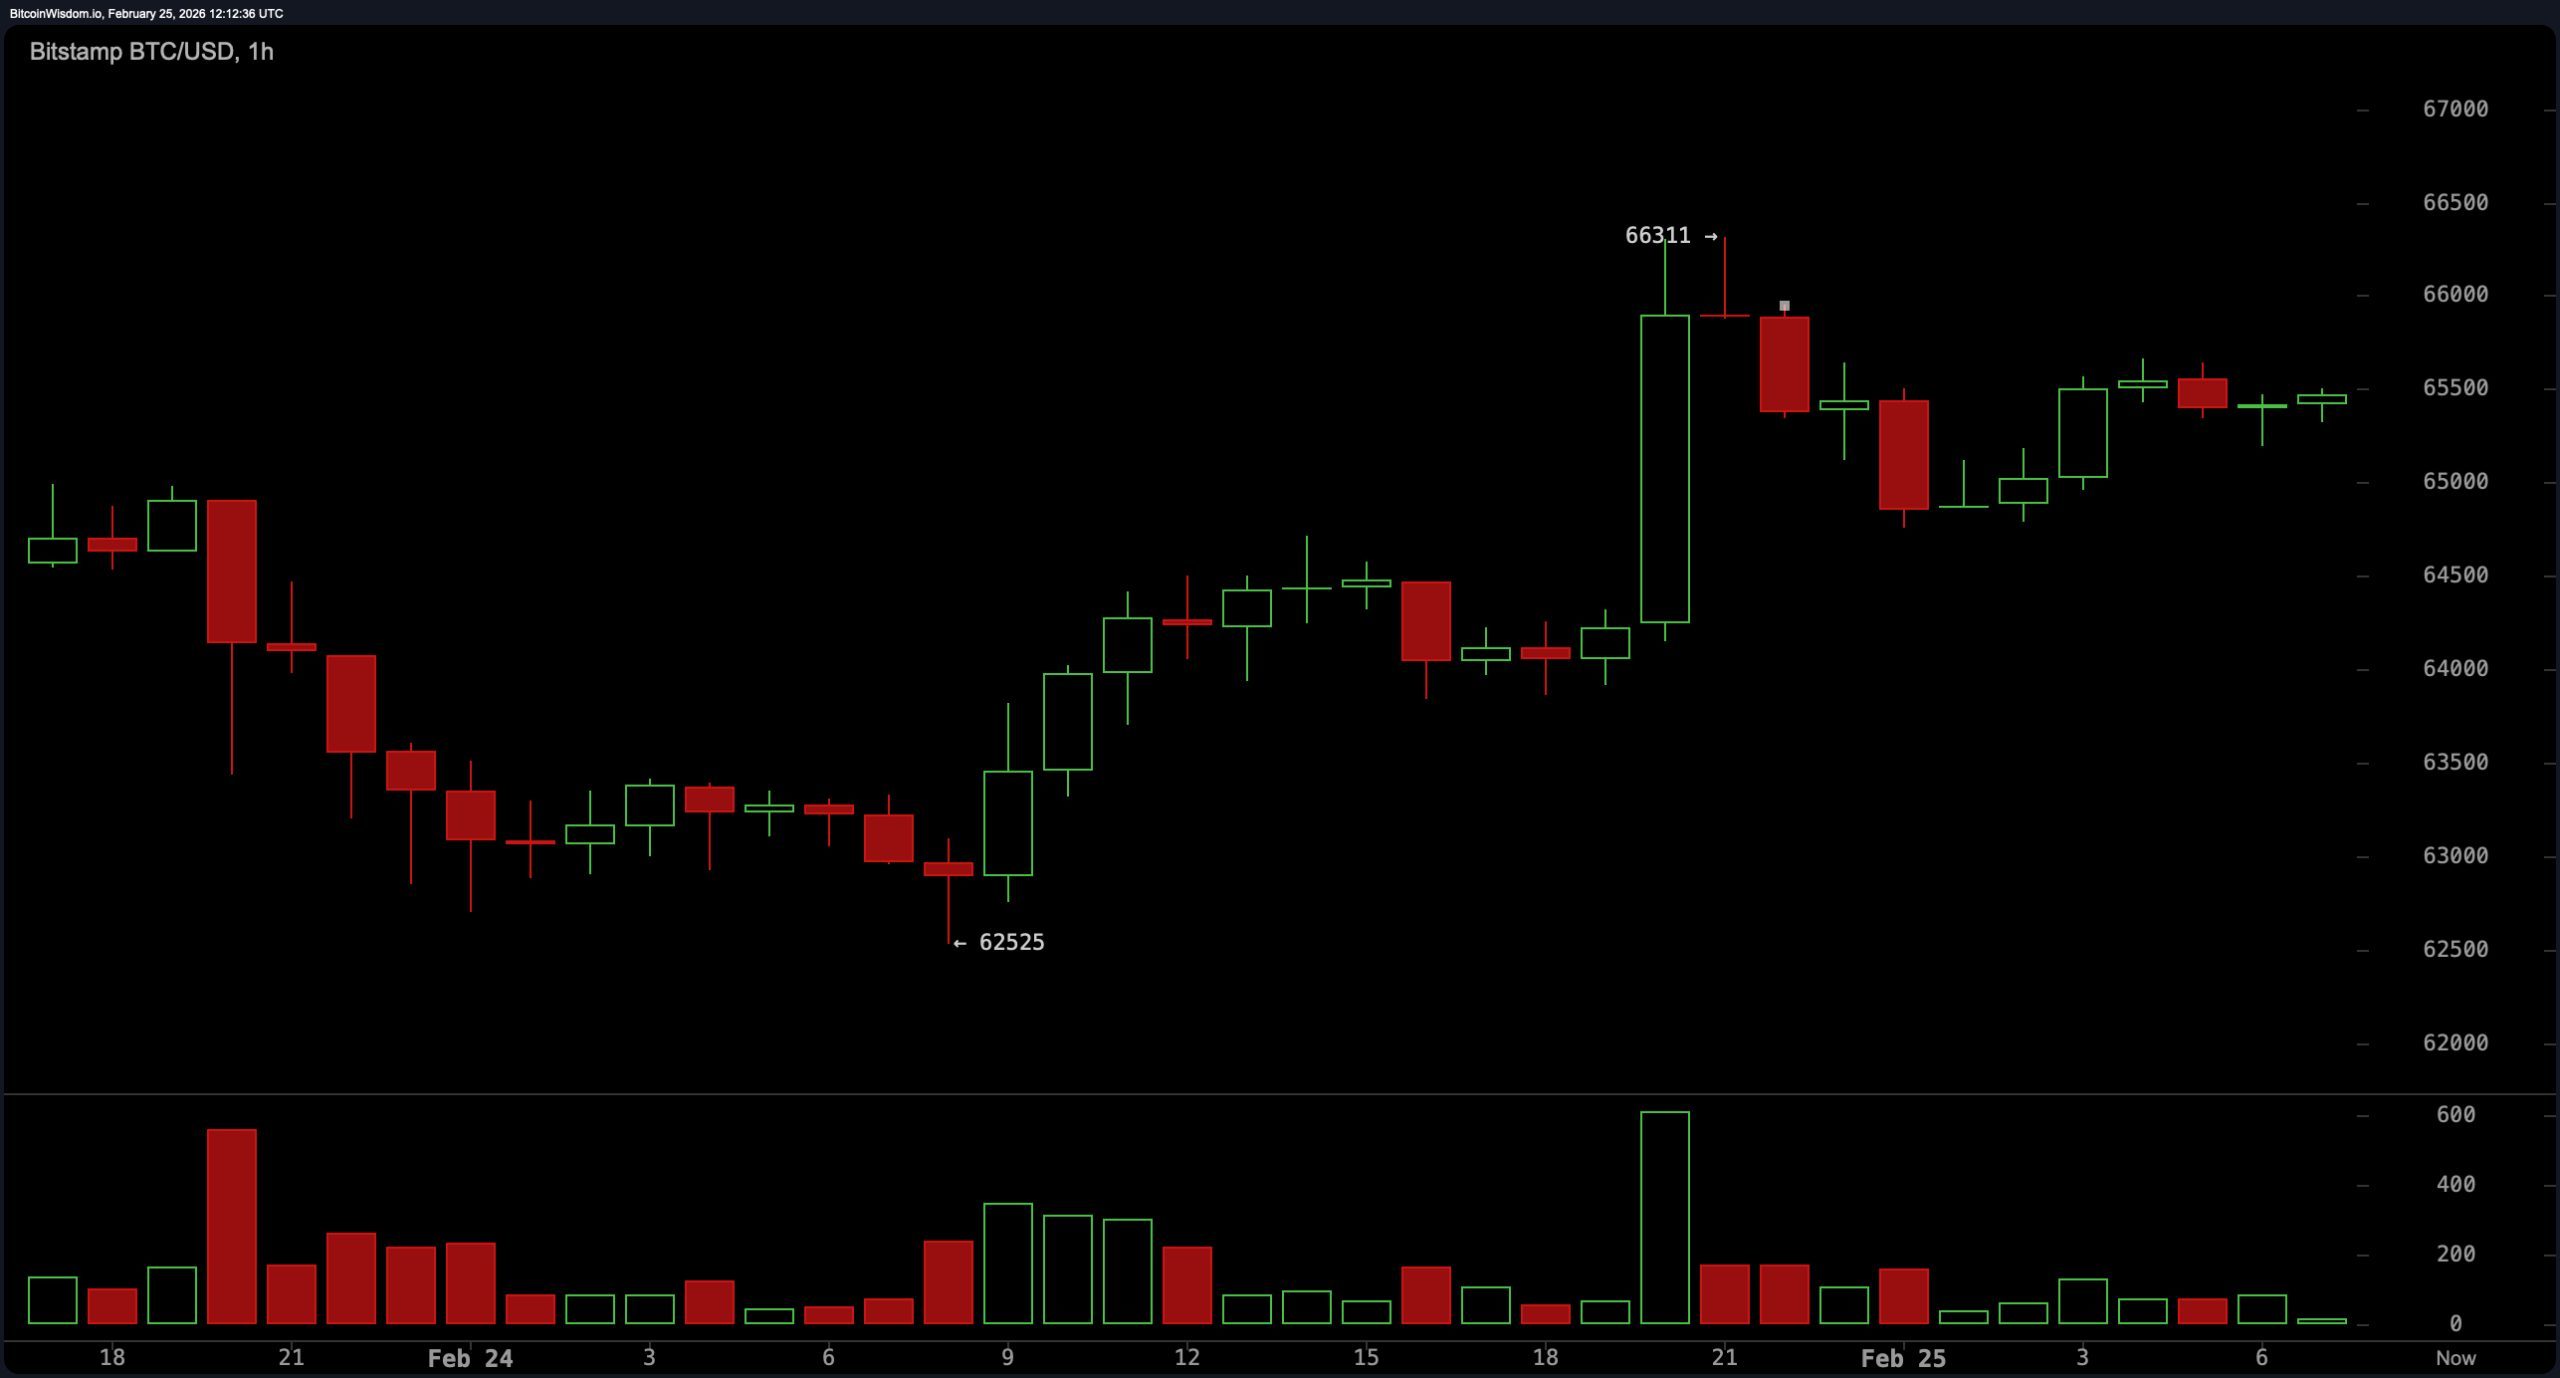
The one-hour chart is where execution meets drama. A strong impulse candle drove the price to $66,300, followed by consolidation marked by higher lows — a compression pattern building directly beneath resistance. The defined scalp zone sits between $64,500 and $65,000, with a breakout trigger on an hourly close above $66,500. Rejection wicks between $66,500 and $67,000 would signal exhaustion, while a structural failure below $63,800 would invalidate the short-term constructive pattern. In other words, bitcoin is coiling — and coils do not stay quiet for long.
Oscillators reflect this internal tug-of-war. The relative strength index (RSI) reads 36, neutral but leaning toward the lower bound of momentum equilibrium. The Stochastic oscillator stands at 21, also neutral. The commodity channel index (CCI) prints −129, indicating a technical bullish condition, while momentum at −3,295 likewise signals bullishness.
The moving average convergence divergence (MACD) level registers −3,720, flashing positivity despite remaining below zero. Meanwhile, the average directional index (ADX) at 58 confirms strong trend strength — unfortunately for optimists, that trend on the daily timeframe remains downward. The Awesome oscillator at −7,656 stays neutral, underscoring mixed but reactive short-term conditions.
Bitcoin’s moving averages (MAs) are decisively bearish. The exponential moving average (EMA) and simple moving average (SMA) framework shows the EMA (10) at $66,639 and SMA (10) at $66,749 signaling sell, followed by the EMA (20) at $69,108 and SMA (20) at $67,855, reinforcing overhead resistance.
The pressure extends through the EMA (30) at $71,843 and SMA (30) at $71,657, then the EMA (50) at $76,347 and SMA (50) at $79,605. Longer term, the EMA (100) at $83,984, SMA (100) at $84,421, EMA (200) at $91,502, and SMA (200) at $98,146 all signal sell — leaving bitcoin trading beneath every major EMA and SMA on the board.
Bull Verdict:
If bitcoin secures an hourly close above $66,500 and follows through with acceptance above $68,000, the structure favors a relief extension toward $70,000 and potentially $72,000. With the commodity channel index (CCI), momentum, and moving average convergence divergence (MACD) all flashing buy signals despite depressed positioning, a short-term squeeze scenario remains technically viable — particularly given the one-hour compression and developing higher lows. A decisive reclaim of $70,000 on the daily timeframe would materially weaken the broader bearish thesis.
Bear Verdict:
Unless bitcoin reclaims and holds above $70,000 on the daily chart, the dominant trend remains down. Price continues to trade beneath every major exponential moving average (EMA) and simple moving average (SMA) from the 10-period through the 200-period, while the daily structure reflects a bearish impulse followed by a lower-high consolidation. Rejection in the $67,000 to $68,000 zone would reinforce downside continuation risk toward $62,000 and potentially a retest of the $59,900 macro support — a path that aligns most cleanly with the prevailing trend strength indicated by the average directional index (ADX).
FAQ 🔎
- What is bitcoin’s key resistance level right now?
Bitcoin faces immediate resistance between $66,800 and $68,000, with major resistance at $70,000. - What are bitcoin’s main support levels on Feb. 25 2026?
Key support sits at $63,000 to $64,000, with major downside support near $59,900 to $60,000. - Is bitcoin in a bullish or bearish trend?
The daily chart shows a clear downtrend unless bitcoin reclaims and holds above $70,000. - What do bitcoin’s technical indicators signal today?
Oscillators show mixed short-term recovery signals, but all major moving averages remain in bearish alignment.