


Veteran trader Peter Brandt sees a potential XRP bet in its long-term price pattern, even as he questions unquestioning loyalty to the token. His Sept. 26 image places that view alongside a more recent retreat.
Peter Brandt Says XRP Charts Alone Give Him Reason to Make a Bet
WRITTEN BY

SHARE
Key Takeaways
- The Sept. 26 chart spans more than a decade of XRP trading.
- Brandt’s earlier $5.40 projection implied a gain of about 251% from $1.54.
- He praised an XRP pattern in 2024 while stating that he held no position.
Brandt Sees an XRP Bet Without Joining Its Devoted Following
XRP’s price history remains compelling to Peter Brandt even as he challenges the devotion of some token supporters. In a Sept. 26 post on X, the veteran trader described his chart-based interest in owning XRP: “It is not necessary to be a certified cult member to be an interested owner of a crypto $XRP.” He added:
“The charts alone have always been enough reason for us to make a bet.”
“There is a difference between being open-minded and having a hole in the dead,” he noted. The founder of trading firm Factor Trading has used classical price charts, which track recurring formations in historical prices, throughout his trading career. Brandt entered commodity markets in 1976 and founded the firm in 1980. His comments describe how he assesses XRP while questioning the conviction of some of its supporters.
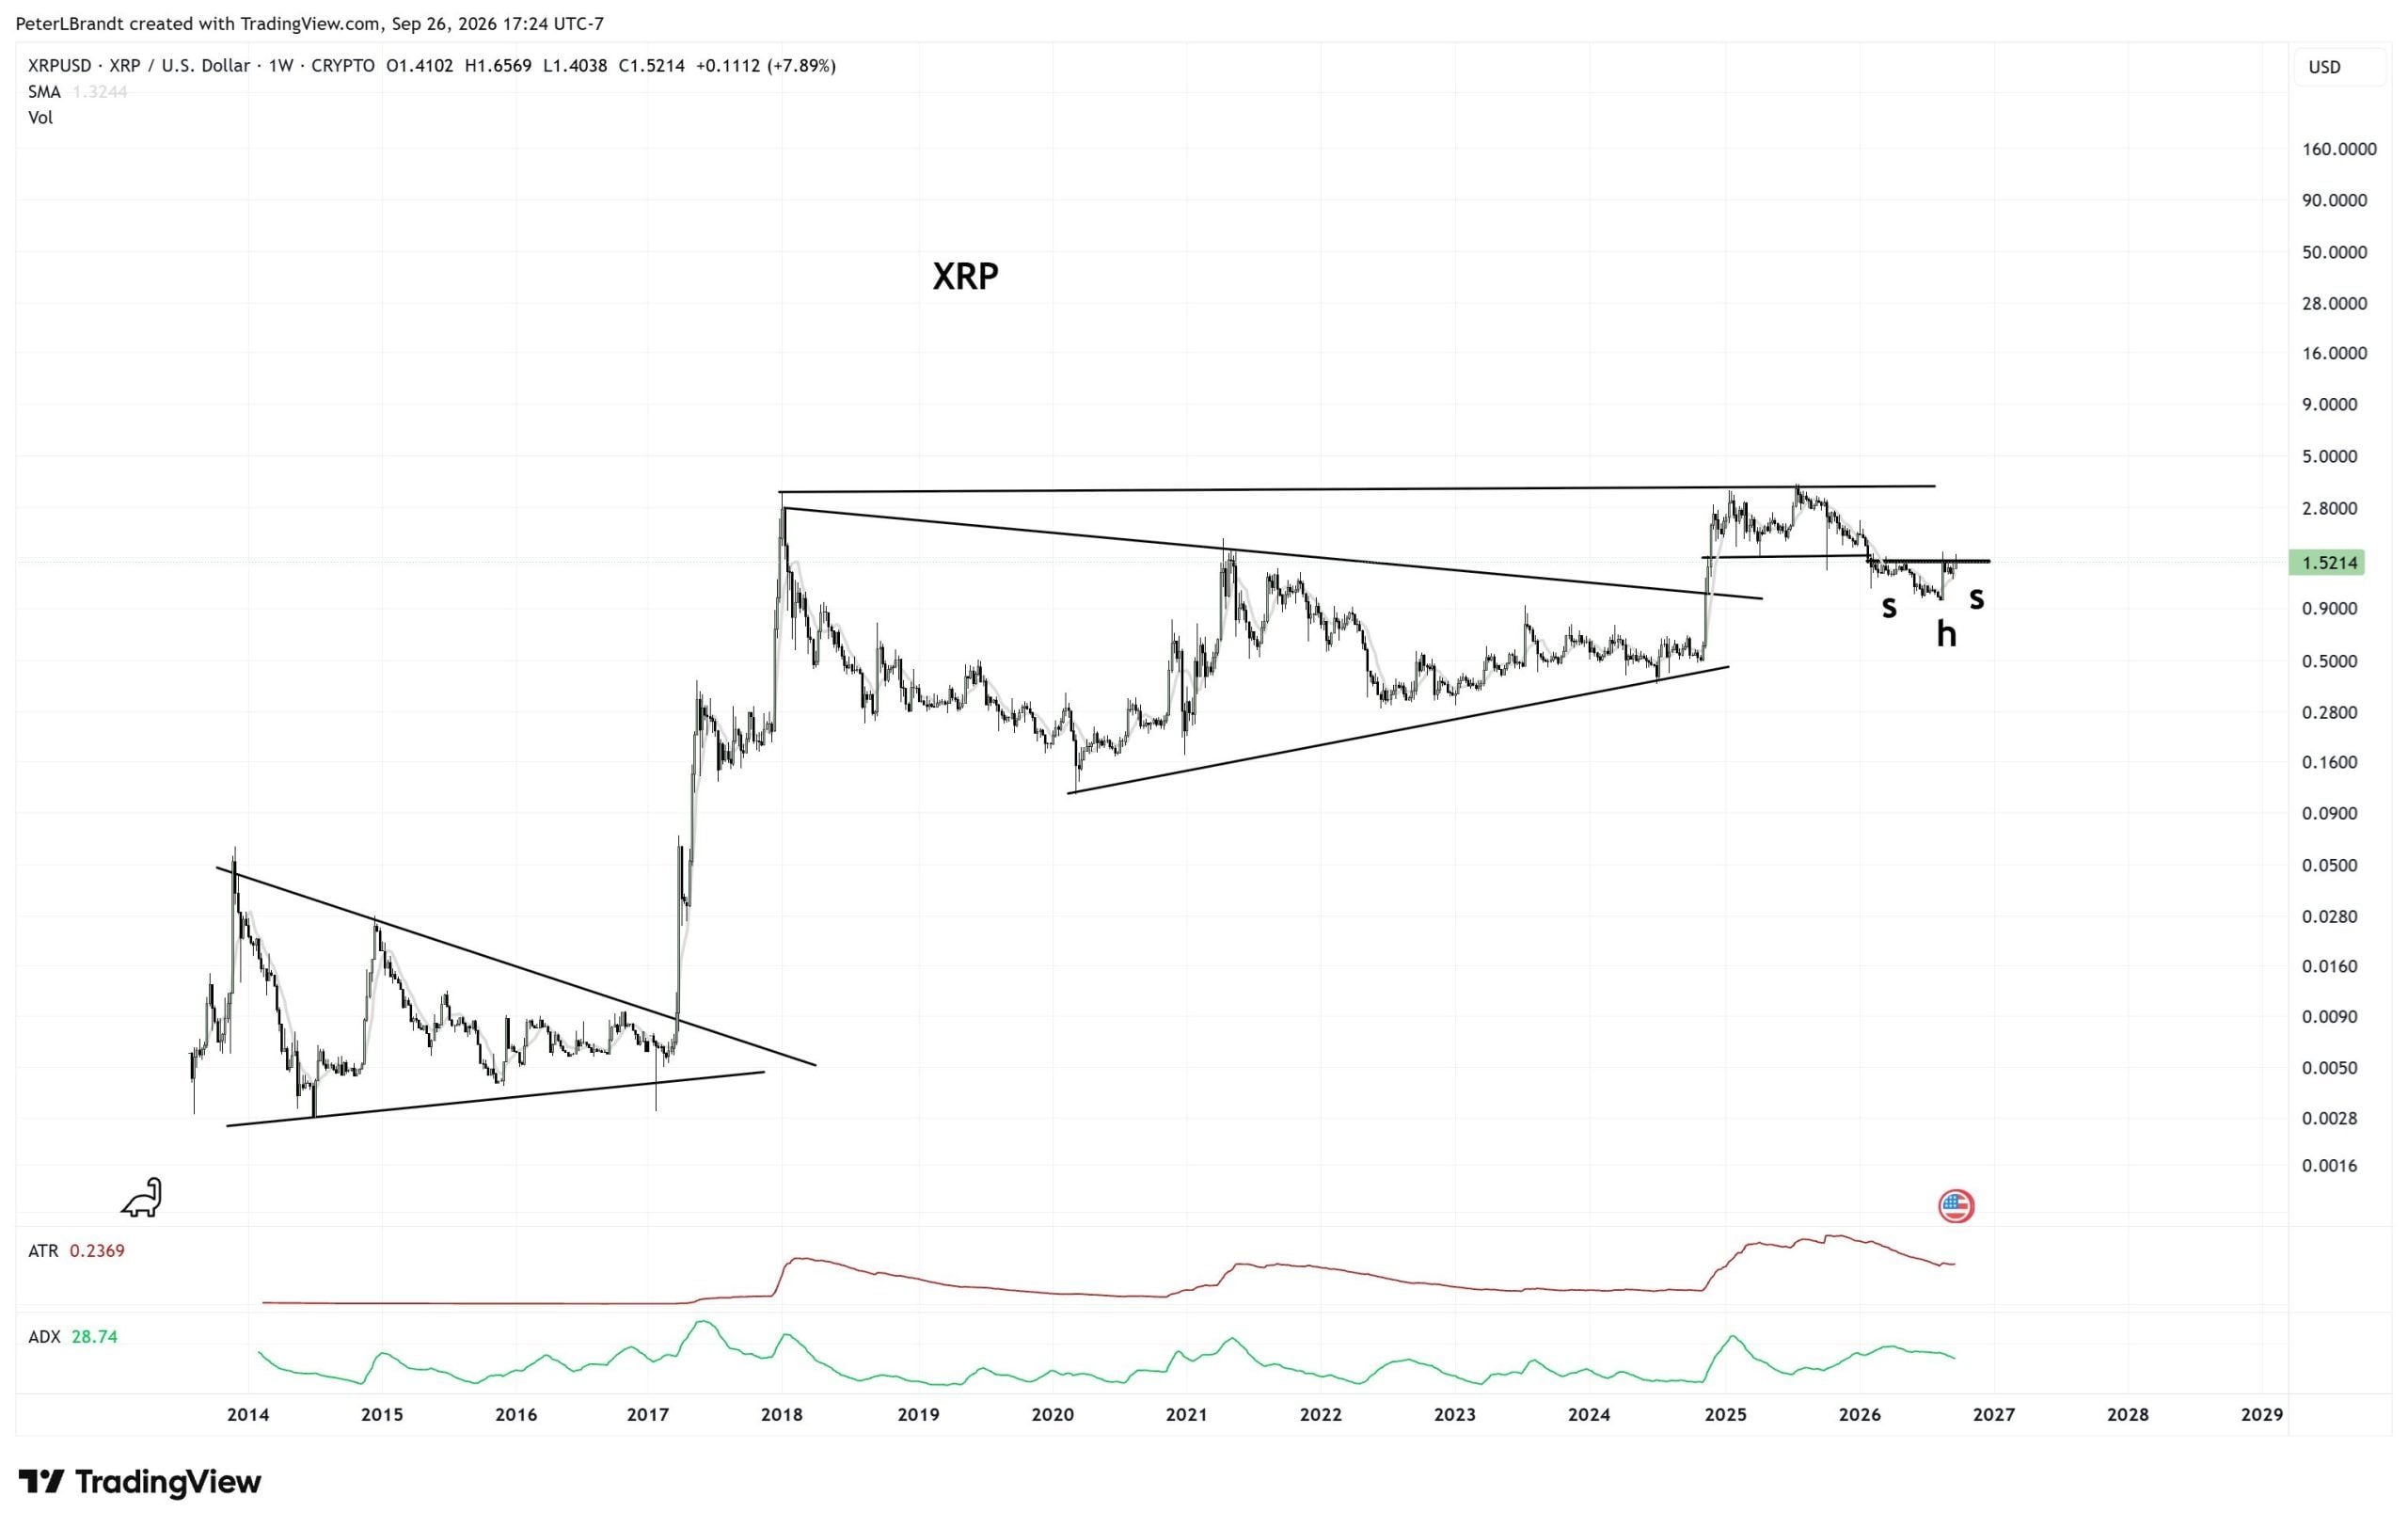
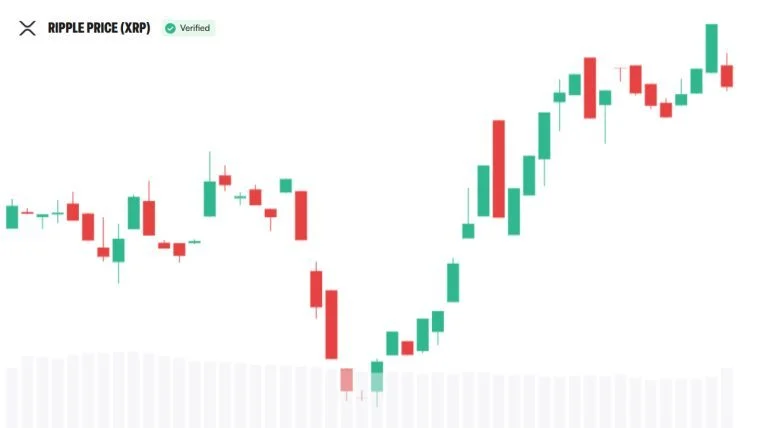
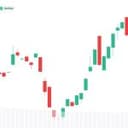
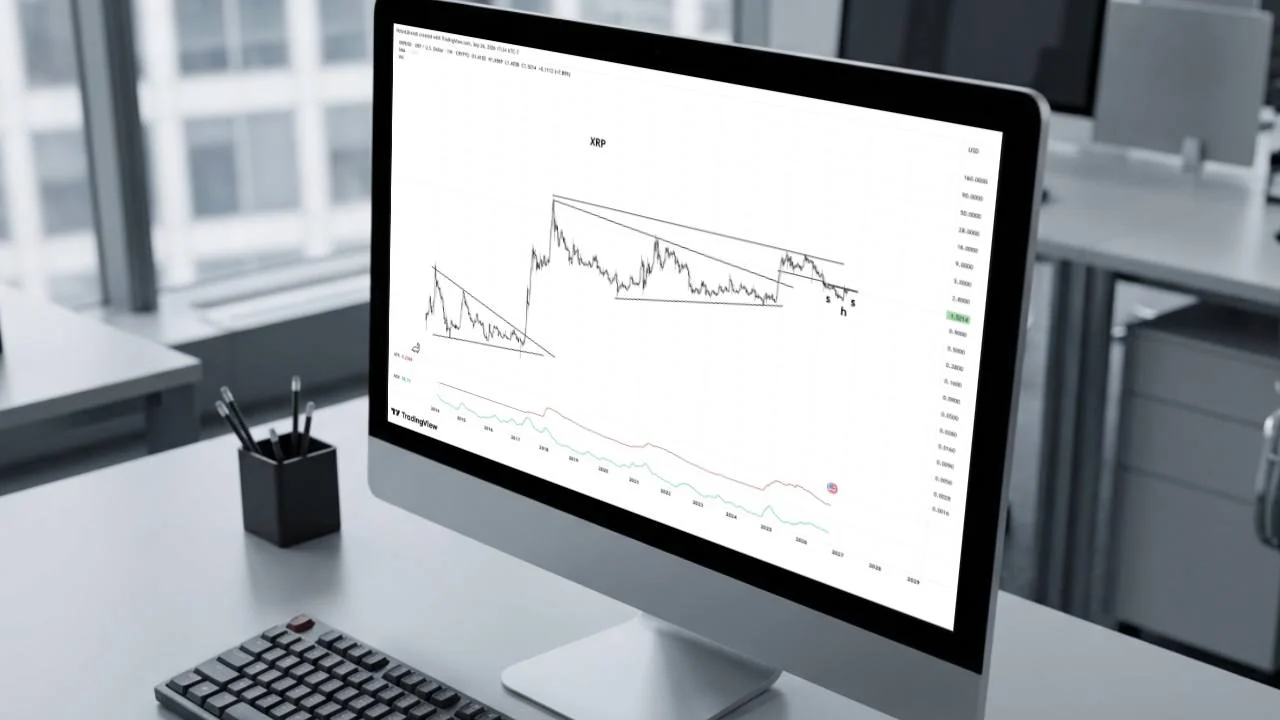
The chart spans more than a decade of XRP trading and highlights two long periods when the trading range narrowed before sharp advances. Brandt also marks a smaller pattern after the recent decline. XRP stood near $1.52, below its $1.66 weekly high but up about 7.9% for the week.
What Brandt’s $5.40 XRP Projection Meant
Brandt’s latest post follows a Sept. 21 long-term XRP chart indicating a possible advance to $5.40. That was a longer-term interpretation of price history. The Sept. 26 post makes a broader point about why charts hold his interest; it does not repeat $5.40 as a new target or set a timetable.
When Brandt shared the earlier projection, XRP traded near $1.54, putting $5.40 roughly 251% above that price. He also distinguished a public chart call from a completed trade, saying that claims about executed trades require evidence beyond an X post. That distinction remains relevant to his latest reference to making a bet.
A formation spanning years and a recent pullback can appear in the same image without describing the same time horizon. Longer and shorter chart views emphasize different price movements. That helps explain how Brandt can remain interested in a broad pattern while marking a nearer decline.
From XRP’s ‘Massive Coil’ to This Week’s Retreat
This is not the first time Brandt has discussed XRP favorably based on its price patterns while distancing himself from allegiance to the token. In November 2024, he highlighted a narrowing XRP price pattern he called a “massive coil,” in which price moved within an increasingly tight range. At that time, he also stated that he held no XRP position that would benefit from a price rise and had no plans to buy it. That statement described his position then, not necessarily now.
The market moved sharply again around Brandt’s September projection. XRP climbed above $1.60 on Sept. 22 before retreating in the Sept. 26 image. During the rise, Santiment counted 1,917 transfers worth at least $100,000 and 3,647 new wallets. The wallet figure counts addresses, not necessarily new investors.