


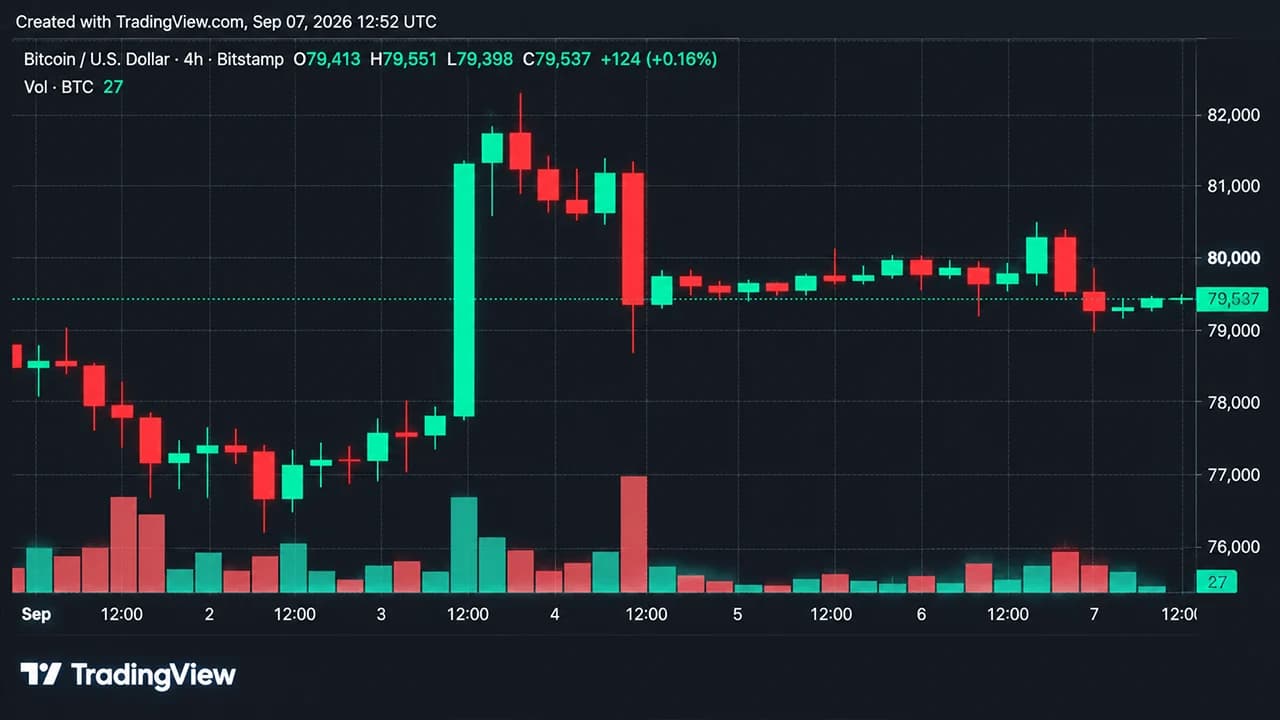
Bitcoin’s price was trading between $79,300 and $79,500 on Sept. 7 after a significant rejection from $80,537 left its short-term price action caught between fading momentum and a still-constructive daily trend. The market remains inside a $79,013-$80,537 intraday range, putting those boundaries firmly in the cards as the levels that could determine what comes next.
Bitcoin Price Rejected at $80.5K as Bulls Scramble to Defend $79K

This article was published more than a month ago. Some information may no longer be current.
WRITTEN BY

SHARE
Key Takeaways
- Bitcoin’s price traded near $79,500 on Sept. 7 after falling from a session high of $80,537.
- Bitcoin’s price still held above 13 bullish daily averages, but the MACD at 3,107 remained a bearish.
- Bitcoin must defend $79,013, while $80,537 and $82,108 remain key upside levels.
Bitcoin’s Hourly Rebound Struggles to Take Back Lost Ground
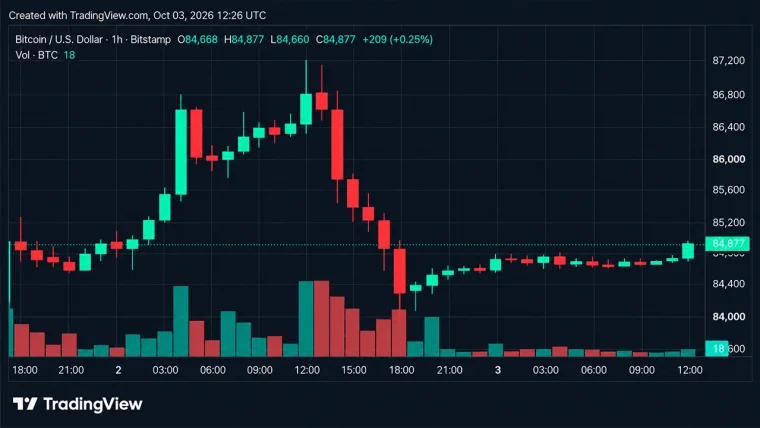
Bitcoin’s price on the 1-hour chart shows how quickly the short-term picture changed. Bitcoin fell from roughly $80,200-$80,537 to $79,013 in one concentrated selling wave before grinding back toward $79,500-$79,520 on lower volume.
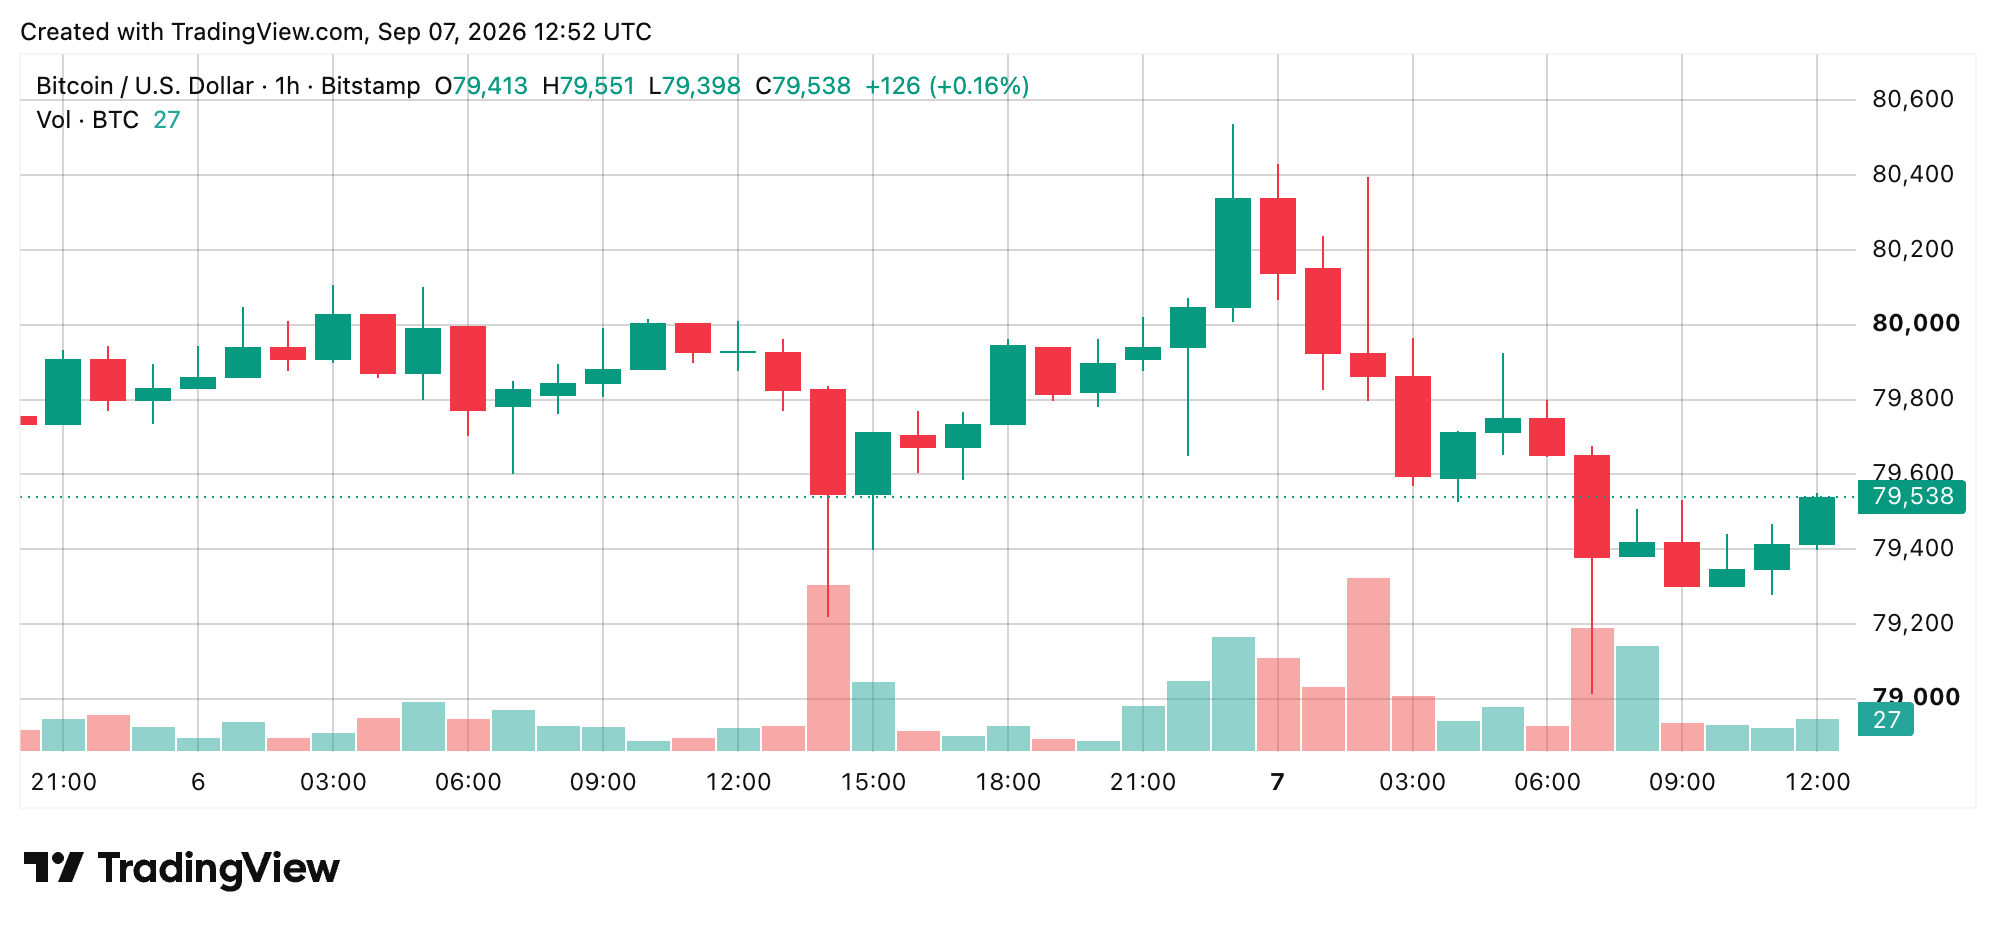
Hourly candles following the low were small-bodied, while offers were stacked from roughly $79,500 upward, and bids thinned quickly below about $79,000. There is a great deal riding on that lower boundary. The rebound represents a repair bounce within the larger 4-hour range, not a confirmed recovery of the breakdown area.
Four-Hour Structure Shows Buyers and Sellers Walking a Tightrope
On the 4-hour chart, bitcoin’s price failed the attempt at $80,500, and it was followed by an impulsive decline to $79,013, with the drop producing the session’s largest volume bars. Subsequent candles became smaller and two-sided between roughly $79,000 and $79,600, leaving the market in a post-impulse balance rather than a fresh directional move.
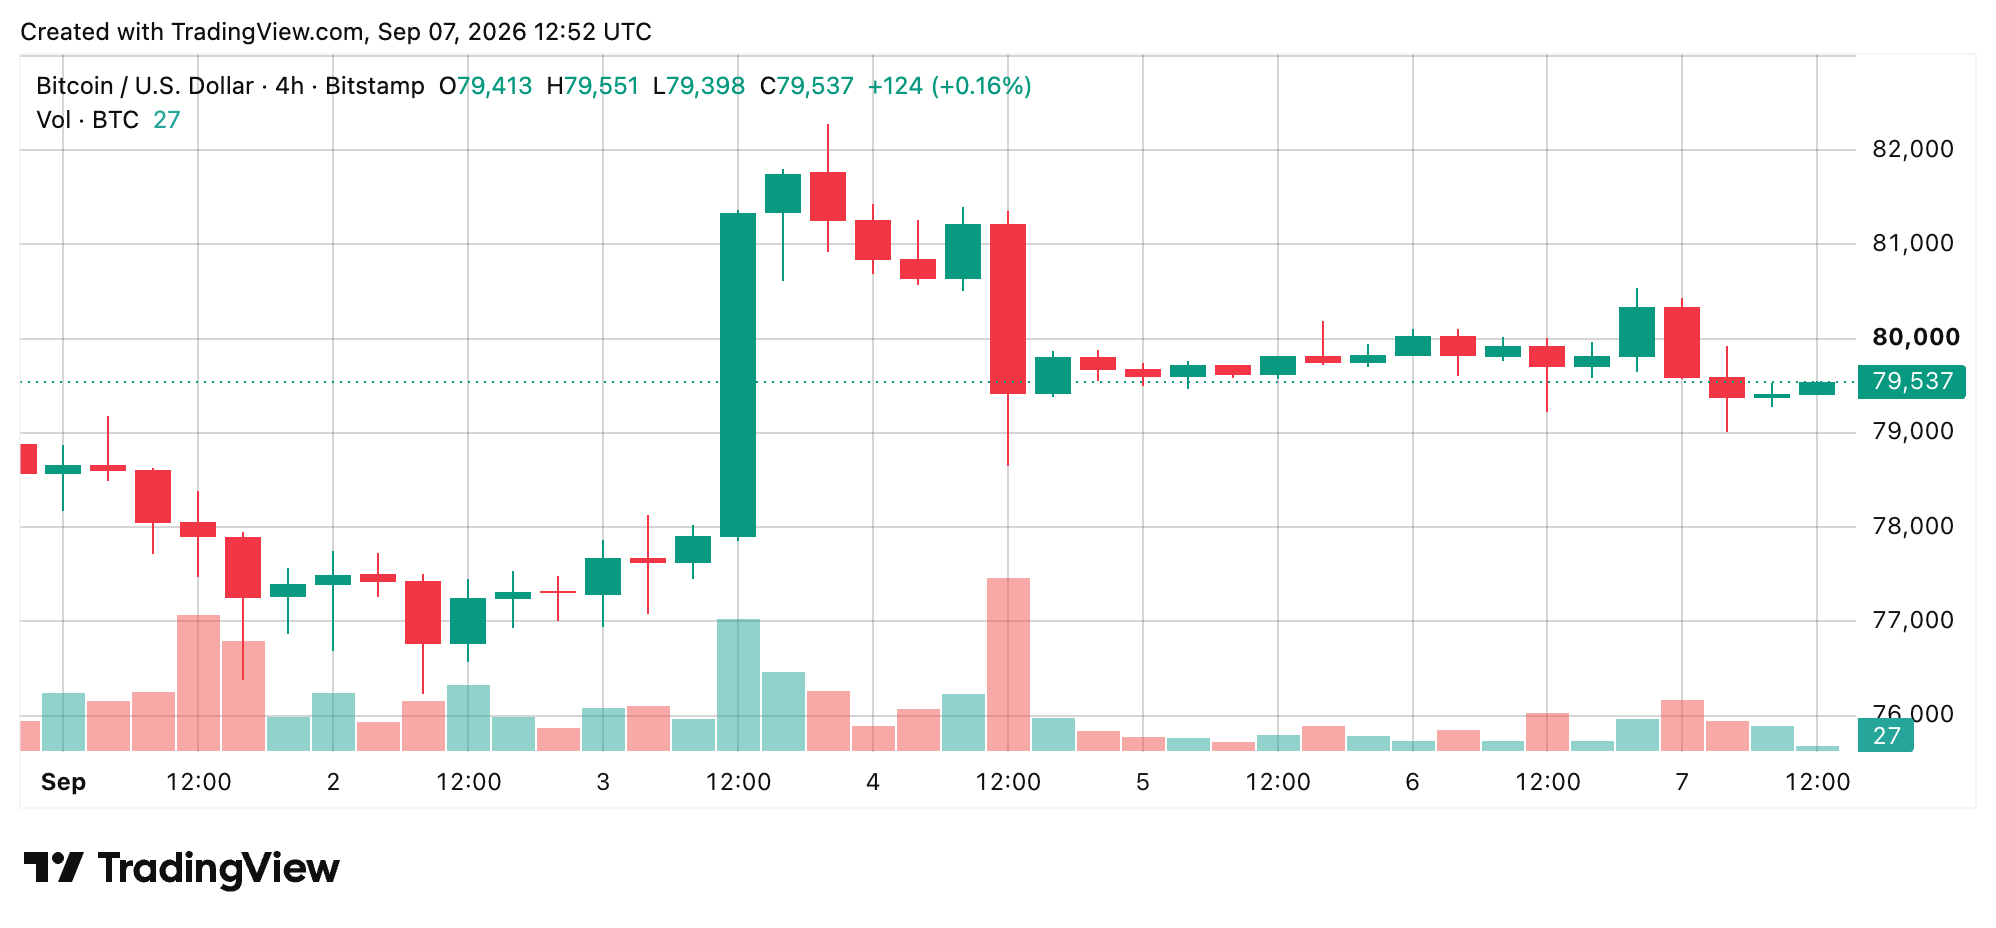
On the flip side, a 4-hour close through $80,000-$80,537 would reopen the path toward the Sept. 3 high. A close below $79,013 would instead put the $76,300-$77,000 region back in play.
Bitcoin’s Daily Uptrend Survives Beneath Last Week’s High
The daily chart tells a more constructive story. Bitcoin climbed into roughly $82,100-$82,200 on Sept. 3 before giving back that advance Sept. 4 and holding roughly $79,500-$80,600 through Sept. 5-6. On Sept. 7, bitcoin’s price reached $80,537 and fell as low as $79,013.
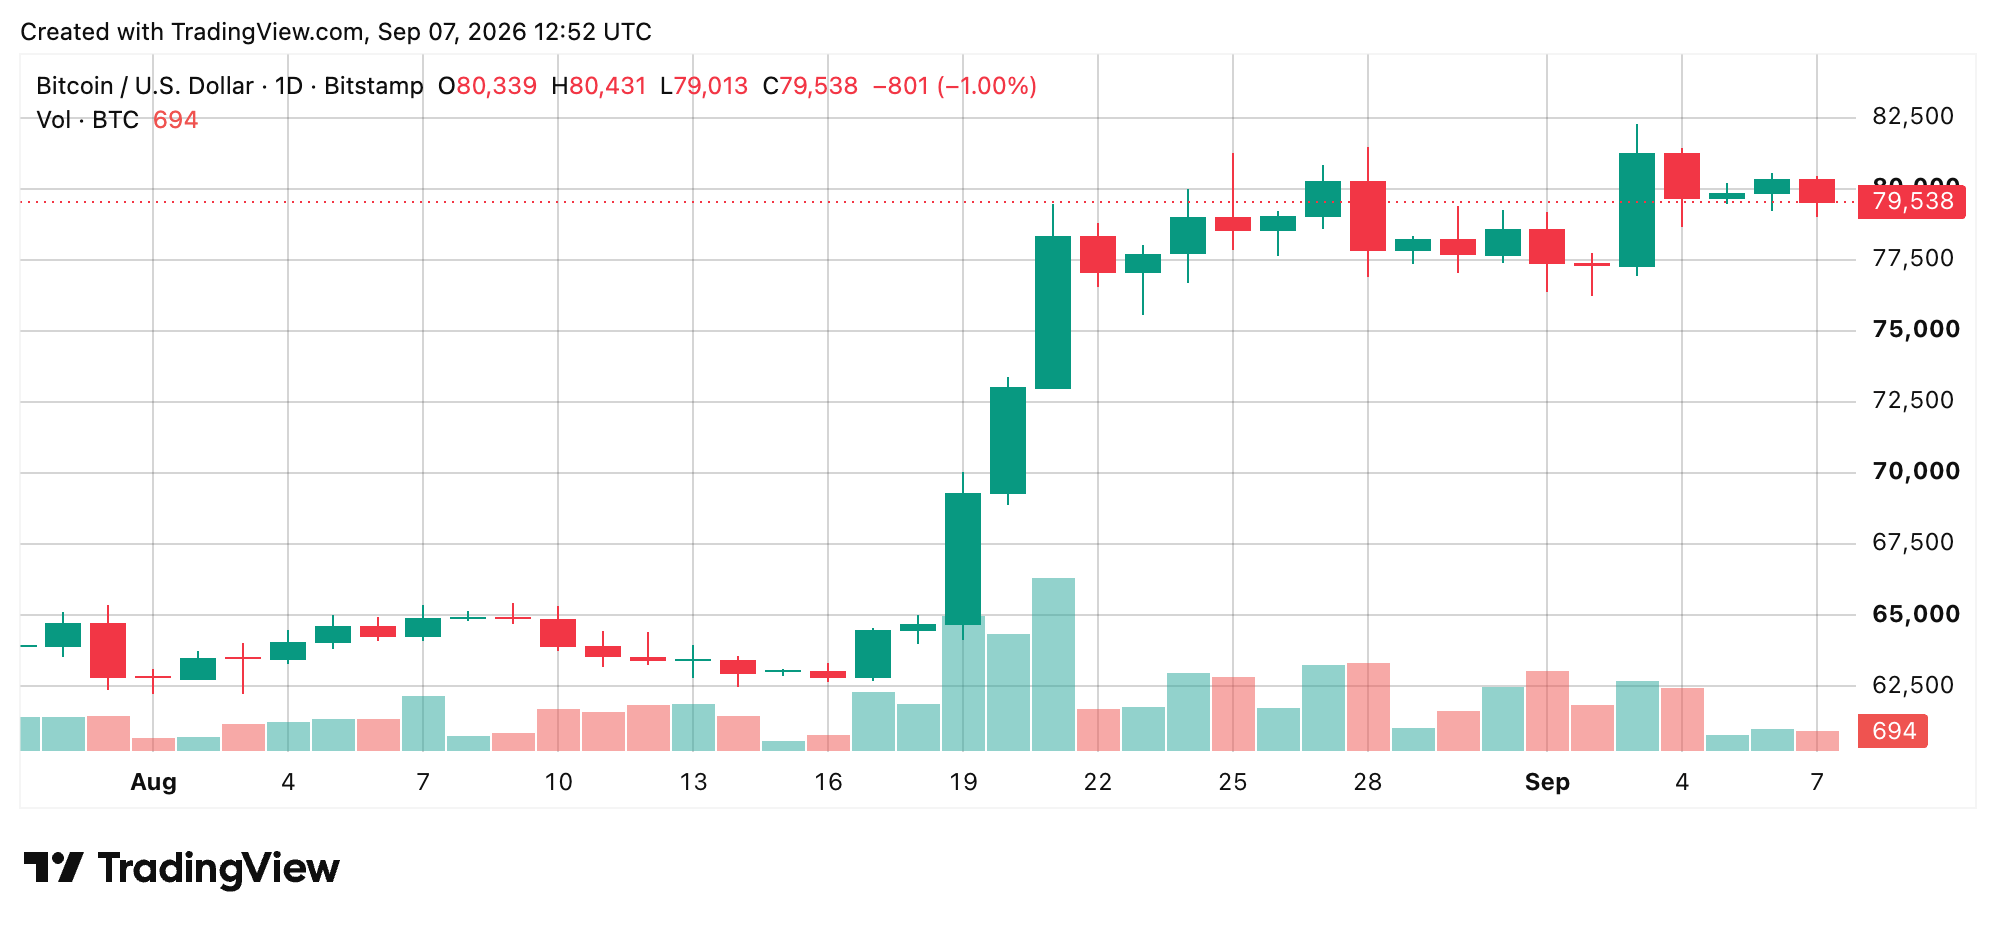
Despite the short-term weakness, bitcoin remained above its key daily averages, meaning the higher-time-frame uptrend had not suffered a confirmed breakdown. Resistance sits first around $80,494-$80,537 and then $82,108, while support extends from $79,013-$79,081 toward $76,298-$76,767.
Oscillators Show Momentum Is Not Fully Back in the Driver’s Seat
Bitcoin’s daily oscillators are far more mixed, with one bearish signal, eight neutral, and two bullish readings. The relative strength index (RSI) stands at 64, Stochastic is around 62, the commodity channel index (CCI) hovers around 69, the average directional index (ADX) stood at 48, the Stochastic RSI Fast an 8, the Williams Percent Range currently stands at minus 47, Bull Bear Power (BBP) is 2,710 and ultimate oscillator (UO) is 57, all neutral. The Awesome oscillator (AO) at 7,799 and the momentum (MOM) at 1,630 signaled bullish sentiment, while the moving average convergence divergence level (MACD) at 3,107 signaled a bearish signal as well.
Moving Averages Keep the Bigger Trend Constructive
The daily chart’s moving average tape remains the stronger part of bitcoin’s technical setup, with 13 bullish readings, one neutral, and one bearish reading. Bullish signals came from the exponential moving average (EMA) (10) at $78,966, simple moving average (SMA) (10) at $78,978, EMA (20) at $76,767, SMA (20) at $77,993, EMA (30) at $74,705, SMA (30) at $73,233, EMA (50) at $72,045, SMA (50) at $69,700, EMA (100) at $70,229, SMA (100) at $66,528, EMA (200) at $72,710, SMA (200) at $69,819 and Volume Weighted Moving Average (VWMA) (20) at $77,220.
The Ichimoku Base Line at $72,375 was neutral at the time of reading, while the Hull moving average (Hull MA) at $80,469 was the lone bear signal. Bitcoin is not out of the woods yet: $79,013 remains the downside trigger, while $80,537 and $82,108 are the upside levels to watch as the dust settles.
Bull Verdict:
Bitcoin’s broader technical structure remains constructive as long as buyers defend $79,013 range and bitcoin’s price stays above the major daily MAs. A sustained move back through $80,537 would put bulls back in the driver’s seat and bring $82,108 into focus. With 13 of 15 daily moving averages flashing bullish signals, the larger trend still has a great deal working in its favor, even as short-term momentum struggles to pick up steam.
Bear Verdict:
The bearish case gets significantly stronger if bitcoin breaks and holds below $79,013, confirming that the rebound toward $79,500 was only a temporary repair bounce. That would put the $76,300-$77,000 area back in play, including the 20-day EMA at $76,767. The MACD remains on the bearish side, and the Hull MA at $80,469 is also flashing negative warnings, meaning bitcoin still faces significant bearish resistance in the near term as it trades below $80,000.
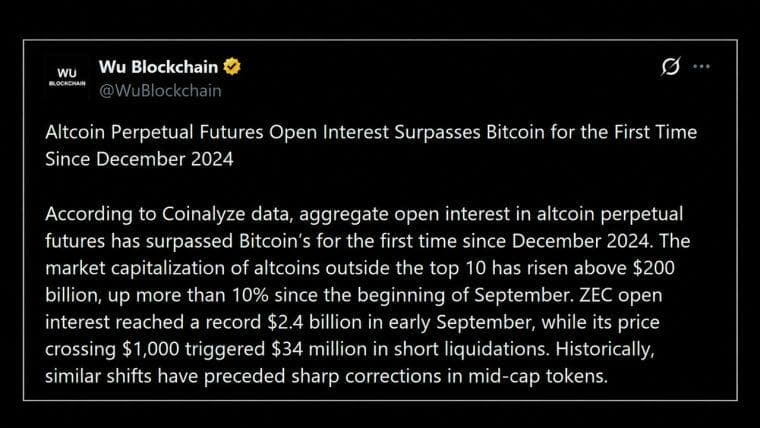
Open interest in altcoin perpetual futures moved above bitcoin's this weekend for the first time since December 2024, a shift…
Read Now: Zcash, XRP and Solana Bets Push Altcoin Leverage Past Bitcoin