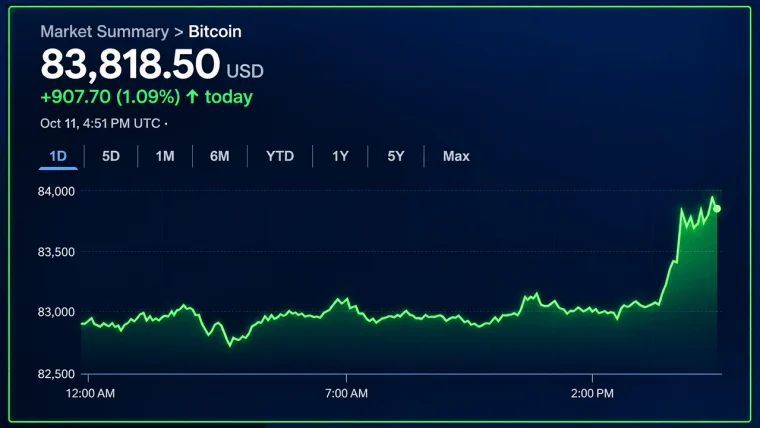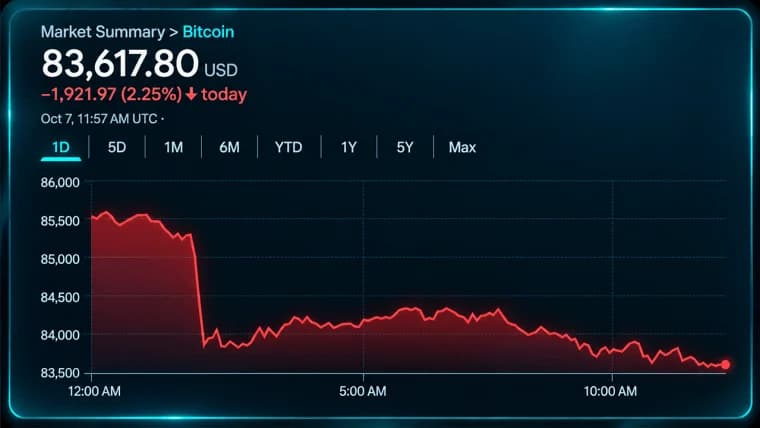



Bitcoin’s price reclaimed $84,000 on Tuesday, Sept. 29, climbing approximately 1% over 24 hours as buyers attempted to repair the damage from a retreat off the $87,374 high. With BTC trading between $83,960 and $84,341 during the morning snapshot, the daily moving averages continue to favor the bulls, although shorter timeframes reveal a recovery still wrestling with overhead resistance.
Bitcoin Price Bounces Back as 13 Moving Averages Flash Green
WRITTEN BY

SHARE
Key Takeaways
- Bitcoin’s price reclaimed $84,000 on Sept. 29 after bouncing from the $82,555 local low. At press time, the price stands between $83,960 and $84,341.
- Market data via the 24-hour timeframe shows 13 moving-average (MA) bullish signals, with bitcoin’s 10-period SMA the lone bearish reading.
- Bitcoin’s price faces resistance at $85,131 and $87,374, while $82,555 remains the key downside threshold.
1-Hour Chart: Buyers Return, but $85,131 Stands in the Way
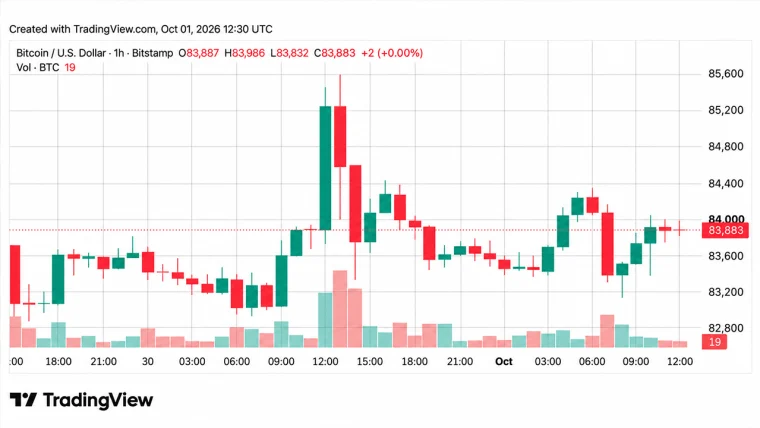
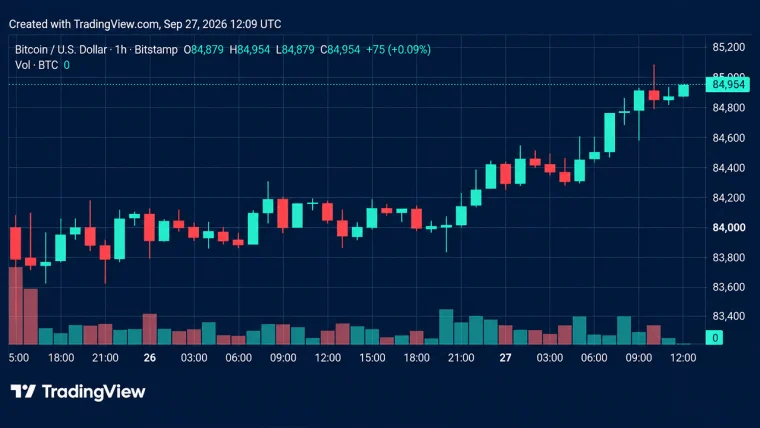
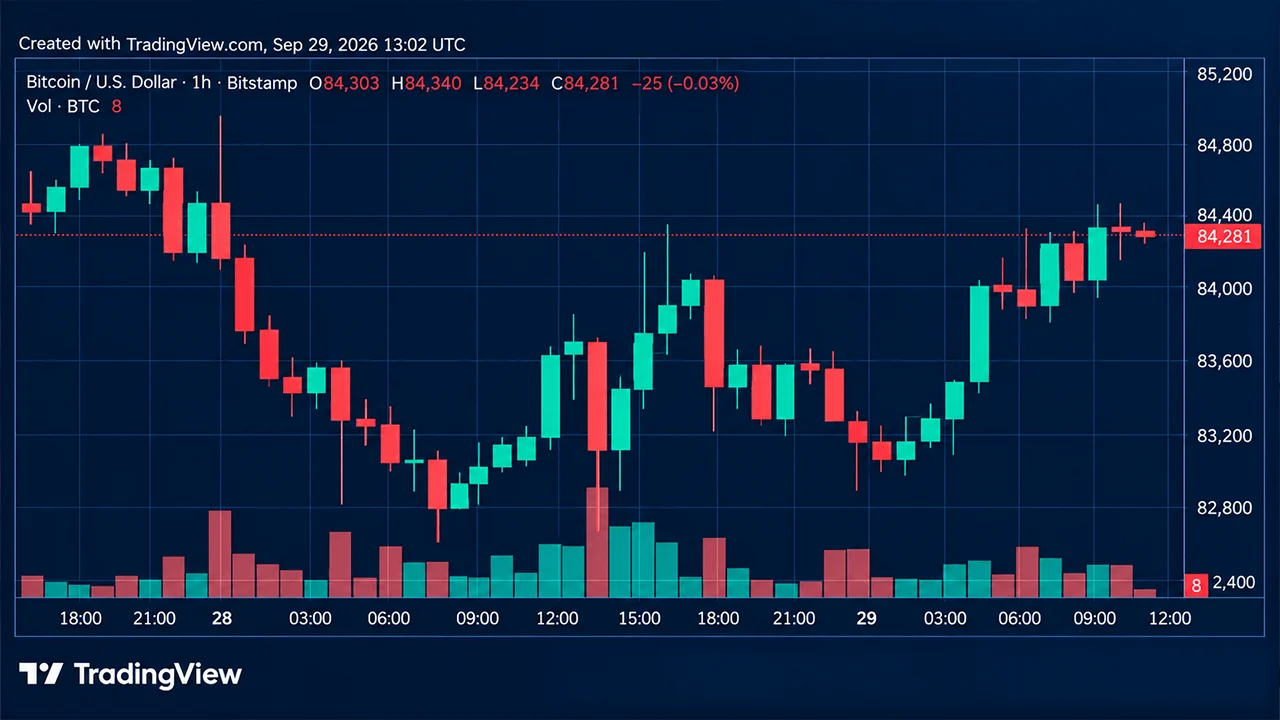
Bitcoin’s price on the hourly chart tells quite a story, beginning with the Sept. 17 low near $74,962 and a sharp advance to $87,374 around Sept. 21-22. That rally subsequently ran out of steam, giving way to a multiday decline and another retreat into the upper $82,000s on Sept. 28.
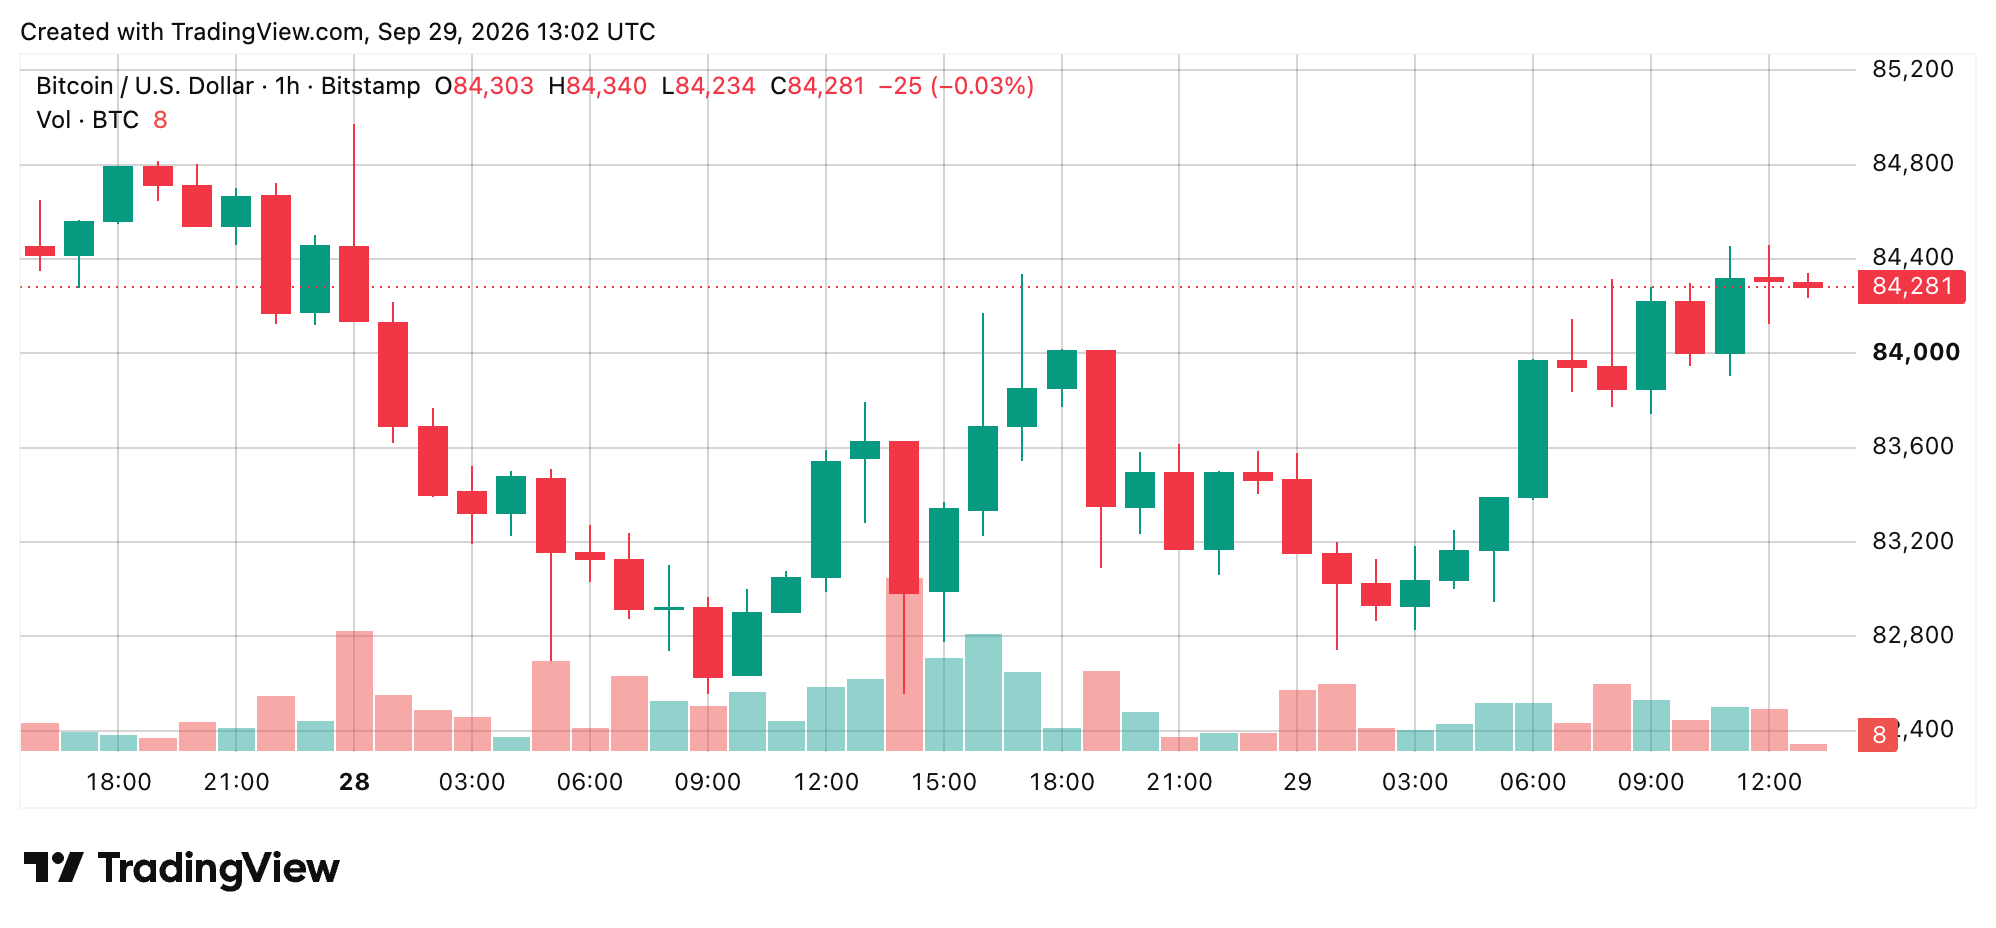
Tuesday’s rebound toward $84,310 puts buyers back in the driver’s seat around the $84,000 liquidity marker, although the broader 82,555-85,131 trading range remains intact.
4-Hour Chart: A V-Shaped Recovery Faces Its Next Test
The four-hour chart shows bitcoin’s price bouncing from $82,555 and reclaiming $84,000 following Monday’s selloff, establishing a V-shaped recovery without producing a fresh breakout. The order-book overlay identifies resting bids around $84,000, while offers are stacked between $84,500 and $85,000.
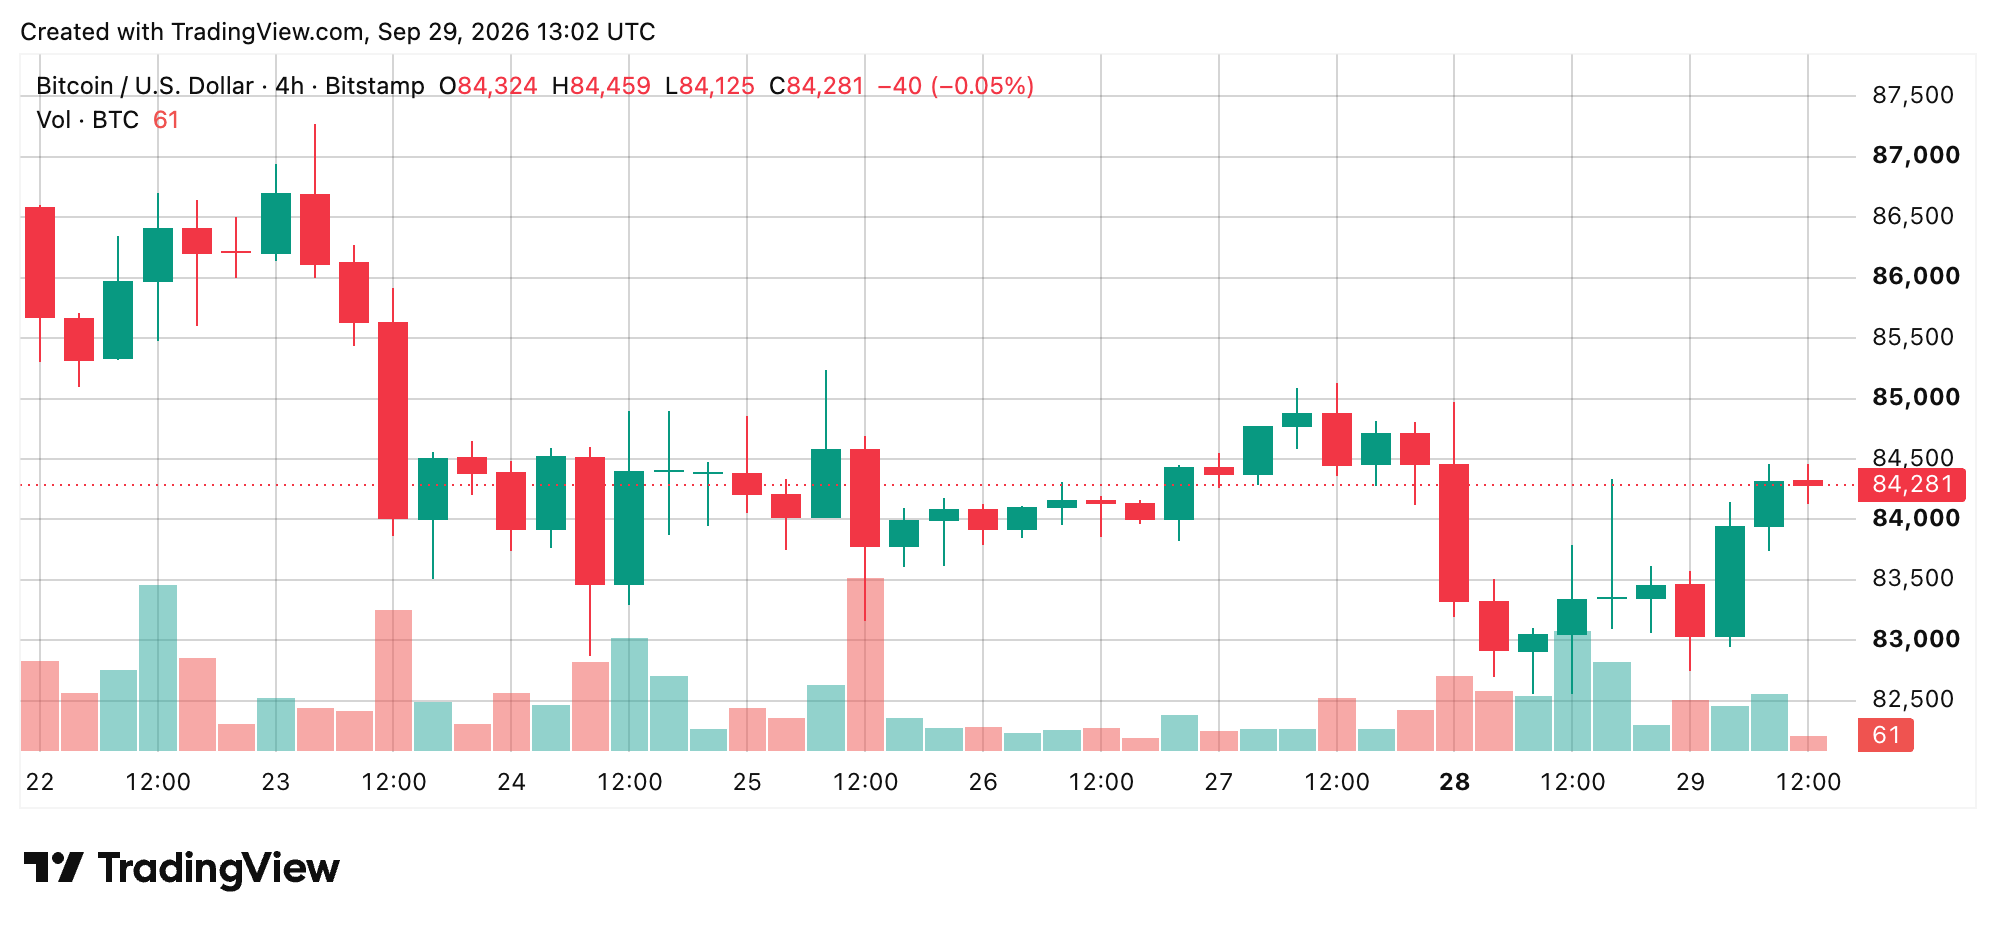
The $85,131 local high remains the next hurdle, with $87,374 representing the larger overhead barrier. Conversely, a four-hour close beneath $82,555 would invalidate the current rebound and place BTC below the Sept. 28 low.
Daily Chart: September’s Rally Takes a Breather
The daily chart retains its upward structure following bitcoin’s price advance from the August swing low near $62,216 to September’s $87,374 peak. Since reaching that high, BTC has pulled back and settled into sideways-to-up trading around the mid-$84,000s, with recent daily volume lighter than during the initial advance.
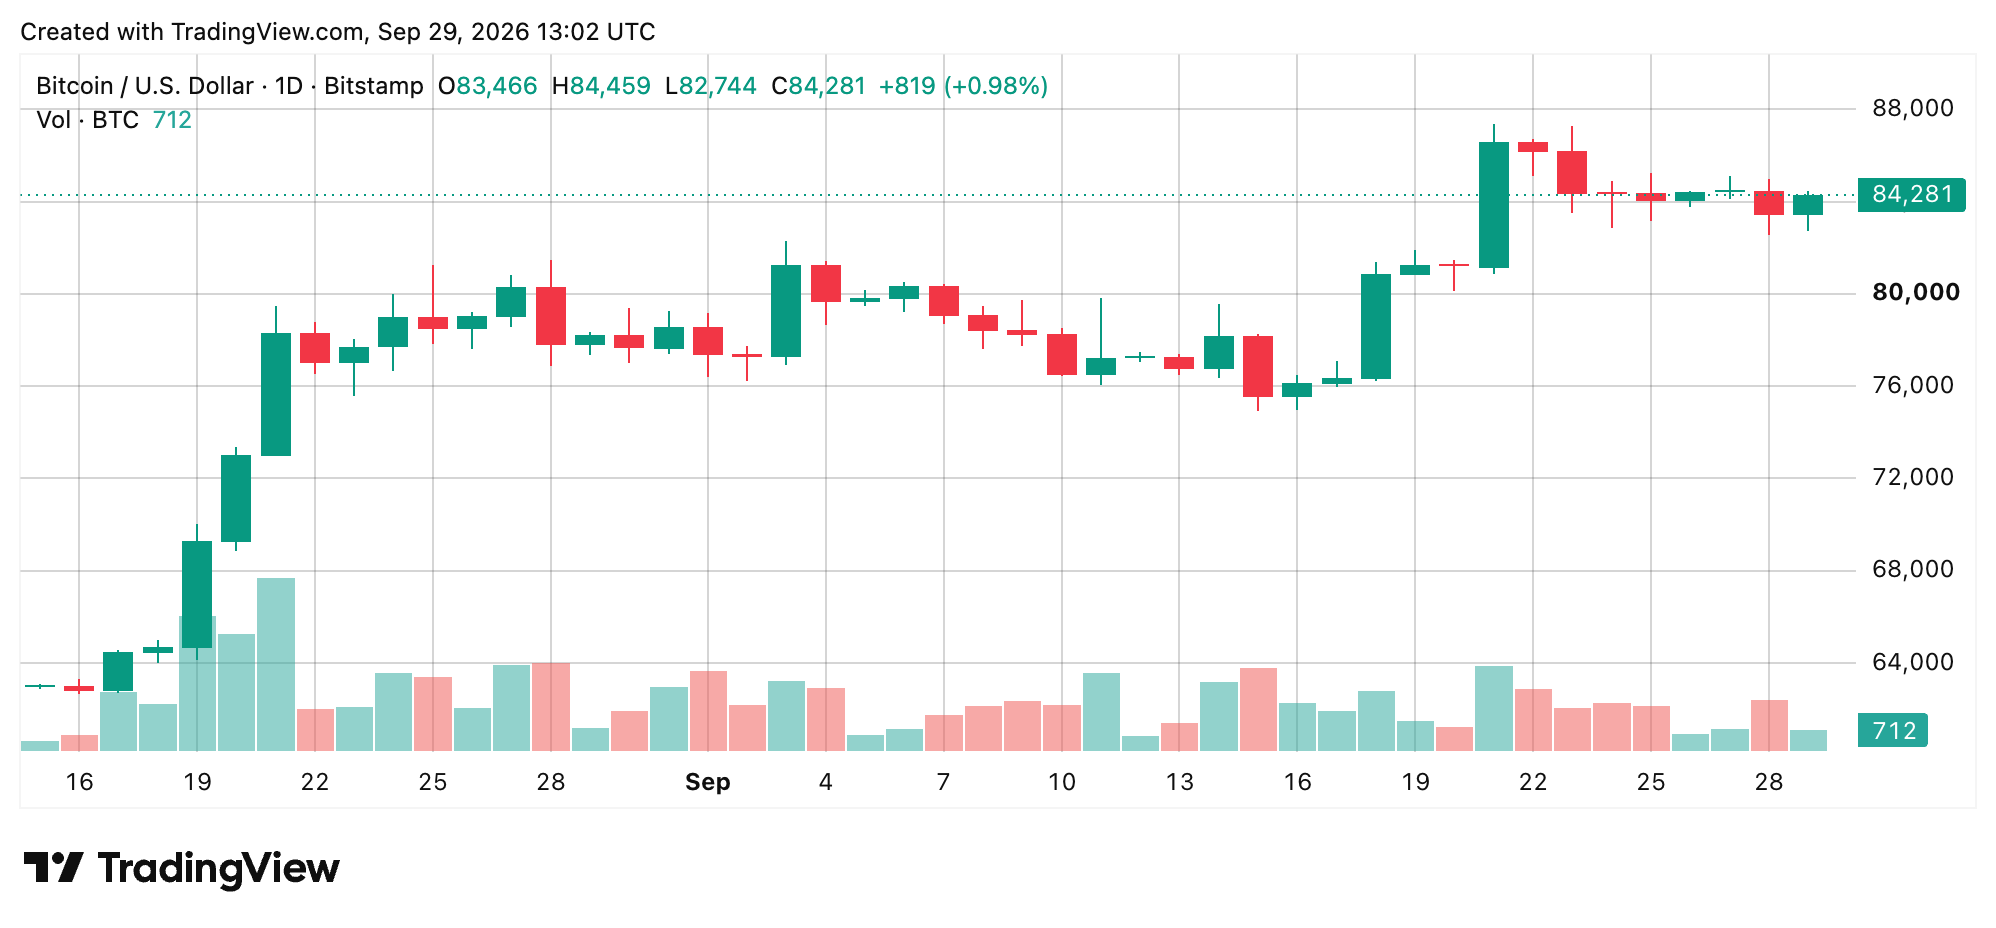
The higher-low sequence remains intact, although the failed hold above $87,000 leaves unfinished business overhead. Immediate support rests around 82,555-82,721, while deeper daily reference levels sit at $81,144, $80,981 and $80,283.
Oscillators: Momentum and MACD Carry the Bullish Argument
The market’s daily oscillators on Tuesday register nine neutral readings and two bullish signals. The relative strength index (RSI) stands at 63, the stochastic at 73, the commodity channel index (CCI) at 59, and the average directional index (ADX) at 42.
The Awesome oscillator (AO) reads 4,027, Stochastic RSI Fast logs 57, Williams percent range sits at minus 25, bull bear power (BBP) reads 1,238, and the Ultimate oscillator (UO) stands at 55. Momentum (10) at 3,046 and moving average convergence divergence (MACD) level at 2,246 deliver the only two bullish signals.
Moving Averages: Thirteen Buy Signals, One Holdout
The moving averages (MAs) are considerably more enthusiastic, registering 13 bullish signals, one neutral, and one bearish signal. The exponential moving averages (EMAs) at 10, 20, 30, 50, 100, and 200 periods stand at $83,475, $81,849, $80,283, $77,568, $74,102 and $74,331, respectively. Their simple moving average (SMA) counterparts read $84,342, $80,981, $80,327, $76,884, $70,105 and $71,206.
The Ichimoku baseline registers neutral at $81,144, while the 20-period volume-weighted moving average (VWMA) at $80,818 and nine-period Hull moving average (HMA) at $83,878 favor buyers. The sole sell belongs to the 10-period SMA, sitting practically on top of bitcoin’s $84,341 spot print.
Bull Verdict:
A four-hour or daily close above $85,131 would strengthen the recovery, placing September’s $87,374 swing high back in focus.
Bear Verdict:
A four-hour close below $82,555 would invalidate the current bounce, exposing deeper daily reference levels around $81,144, $80,981 and $80,283.

Kalshi traders pushed the odds of bitcoin hitting $100,000 in 2026 from 17% to 43% in under a week, and…
Read Now: Bitcoin Price to Hit $100K in 2026? Kalshi Gives It a 34% Chance