Gold and silver posted their strongest weekly performance in more than a month after a disappointing U.S. jobs report forced traders to rethink Federal Reserve policy.
Gold and Silver Tighten Ratio to 66.9 as Both Metals Roar Higher
WRITTEN BY
SHARE
Key Takeaways
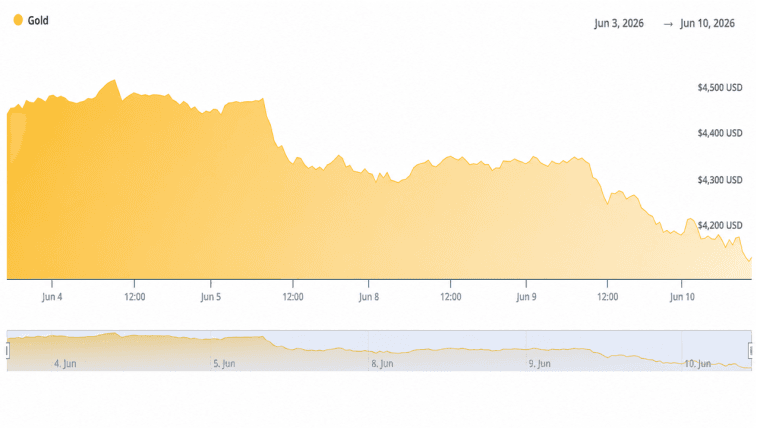
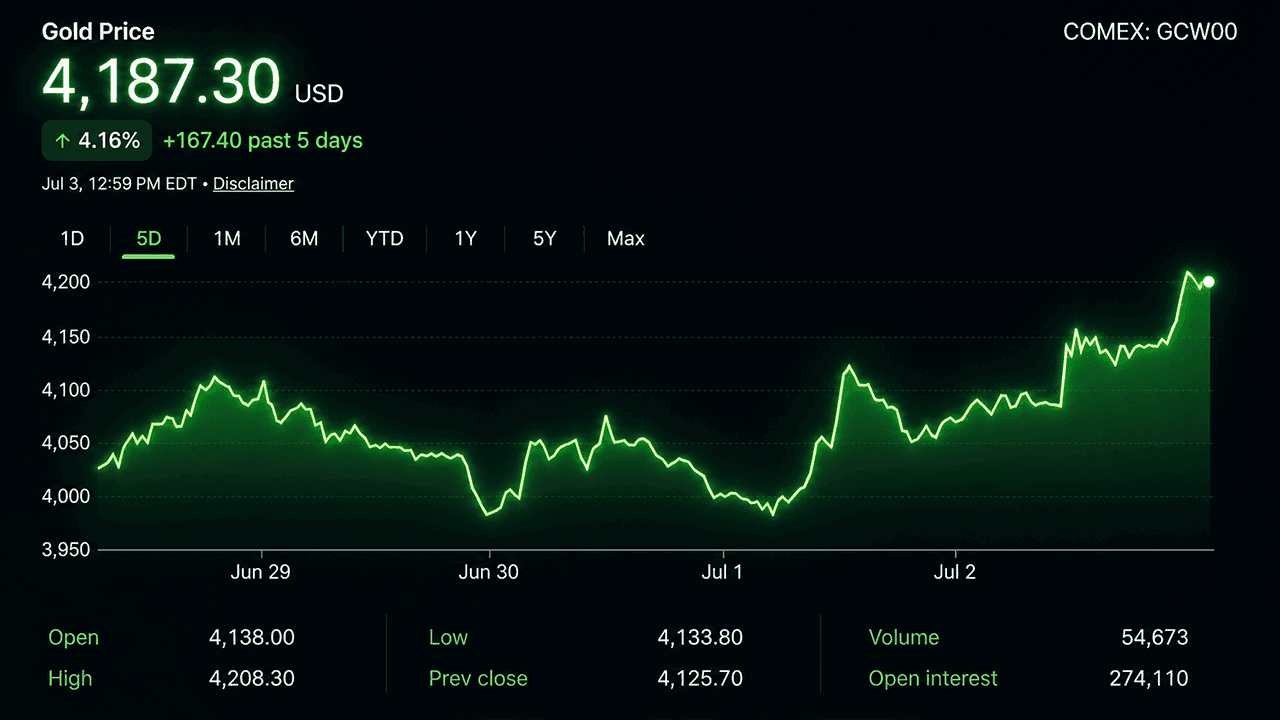
- Gold climbed to $4,175 on July 3 after U.S. payrolls rose just 57,000 in June. On Saturday, July 4, gold was $4,187 per ounce at 11:30 a.m. Eastern time.
- Silver surged 7% to over $62, narrowing the gold to silver ratio to 66.9.
- Traders cut September Fed rate hike odds from 66% to 53% following the report.
Gold prices climbed from lows near $4,012 per ounce on June 30 to close around $4,175 by July 3, a gain of roughly 2.1%. It marked the metal’s first weekly advance in five weeks, according to aggregated market data covering June 27 through July 4. On America’s Independence Day, July 4, gold was trading hands at $4,187 per troy ounce.
Silver moved even further. The metal rose from around $58.3 per ounce to more than $62.4, a jump of 6% to 7%, outpacing gold throughout the rebound.
Jobs Report Rattles Rate Expectations
The U.S. Bureau of Labor Statistics reported nonfarm payrolls rose by just 57,000 in June, far short of economist forecasts near 110,000. Unemployment ticked up to 4.2%, and private payroll growth softened alongside the headline miss.
Traders responded fast. The probability of a September Fed rate hike, tracked through the CME Fedwatch Tool, fell from around 66% to roughly 53% to 54% in the days following the release.
Lower rate hike odds weakened the dollar and pulled down real yields, both of which support gold and silver since neither metal pays interest. OCBC strategists described their outlook on gold as “cautiously constructive” following the data.
Silver’s Industrial Demand Adds Fuel
Silver’s sharper rebound reflected its dual identity as both a monetary metal and an industrial input. Demand tied to solar panels, electronics, and electric vehicles has kept the metal’s long-term demand elevated even as prices pulled back through the second quarter.

The gold-to-silver ratio, a measure of how many ounces of silver it takes to equal one ounce of gold, narrowed to about 66.9 to 1 by the end of the period as silver closed the gap on gold’s earlier outperformance.
Schiff Weighs In as Prices Dipped Below $4,000
Gold economist Peter Schiff commented on the June 30 dip below $4,000, tying it partly to yen weakness against the dollar. Schiff argued that traders fleeing a weak yen for dollars were “jumping from the frying pan into the fire” by choosing dollars over gold.
Schiff has repeatedly argued gold’s long-term performance should be measured against the dollar rather than equities, pointing to its rise from under $300 in 1999 to current levels above $4,000.
What Comes Next
Gold remains about 22% below its early 2026 peak above $5,300, and silver has given back even more from its January highs. Resistance for gold sits near $4,200 to $4,300, while silver faces a psychological ceiling near $65.
Analysts expect upcoming inflation data, retail sales figures, and further employment reports to determine whether the rebound extends or gives way to consolidation. Central bank buying and geopolitical developments tied to U.S.-Iran diplomacy remain background factors supporting both metals heading into mid-July.