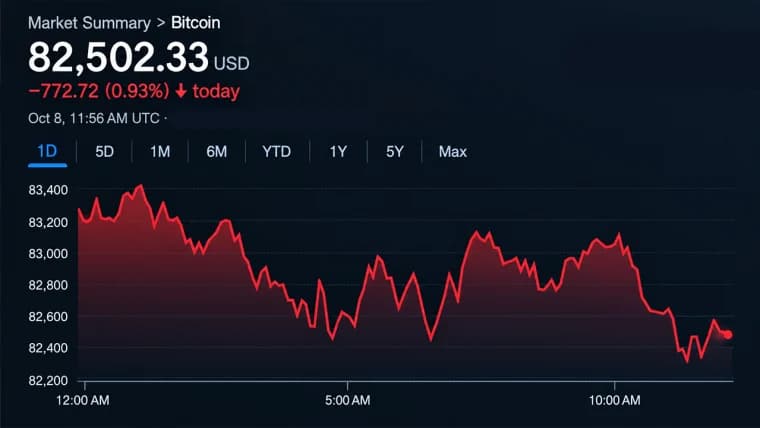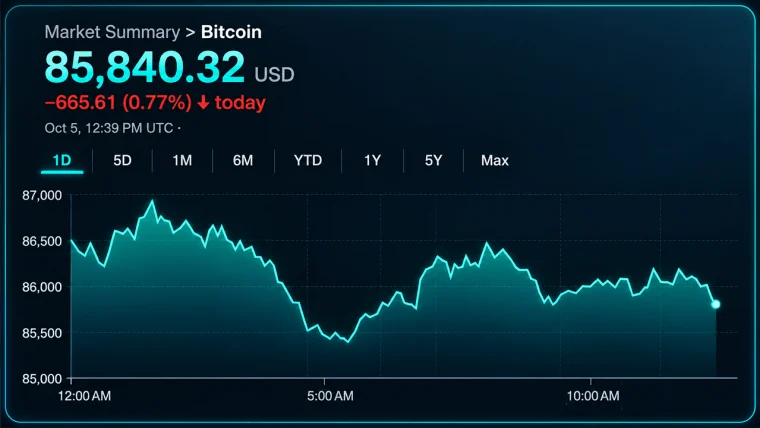



Bitcoin continues its tug-of-war with gravity after an unforgiving plunge from record highs. On Feb. 8, 2026, bitcoin is priced at $70,854, boasting a market capitalization of $1.41 trillion and a 24-hour trading volume of $50.09 billion. The price ranged intraday from $68,443 to $70,976—swinging like a caffeinated pendulum through volatile terrain.
From Boom to Bruised: Bitcoin Claws Back After Crash to $60K

This article was published more than a month ago. Some information may no longer be current.
WRITTEN BY

SHARE

Bitcoin Chart Outlook
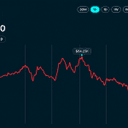
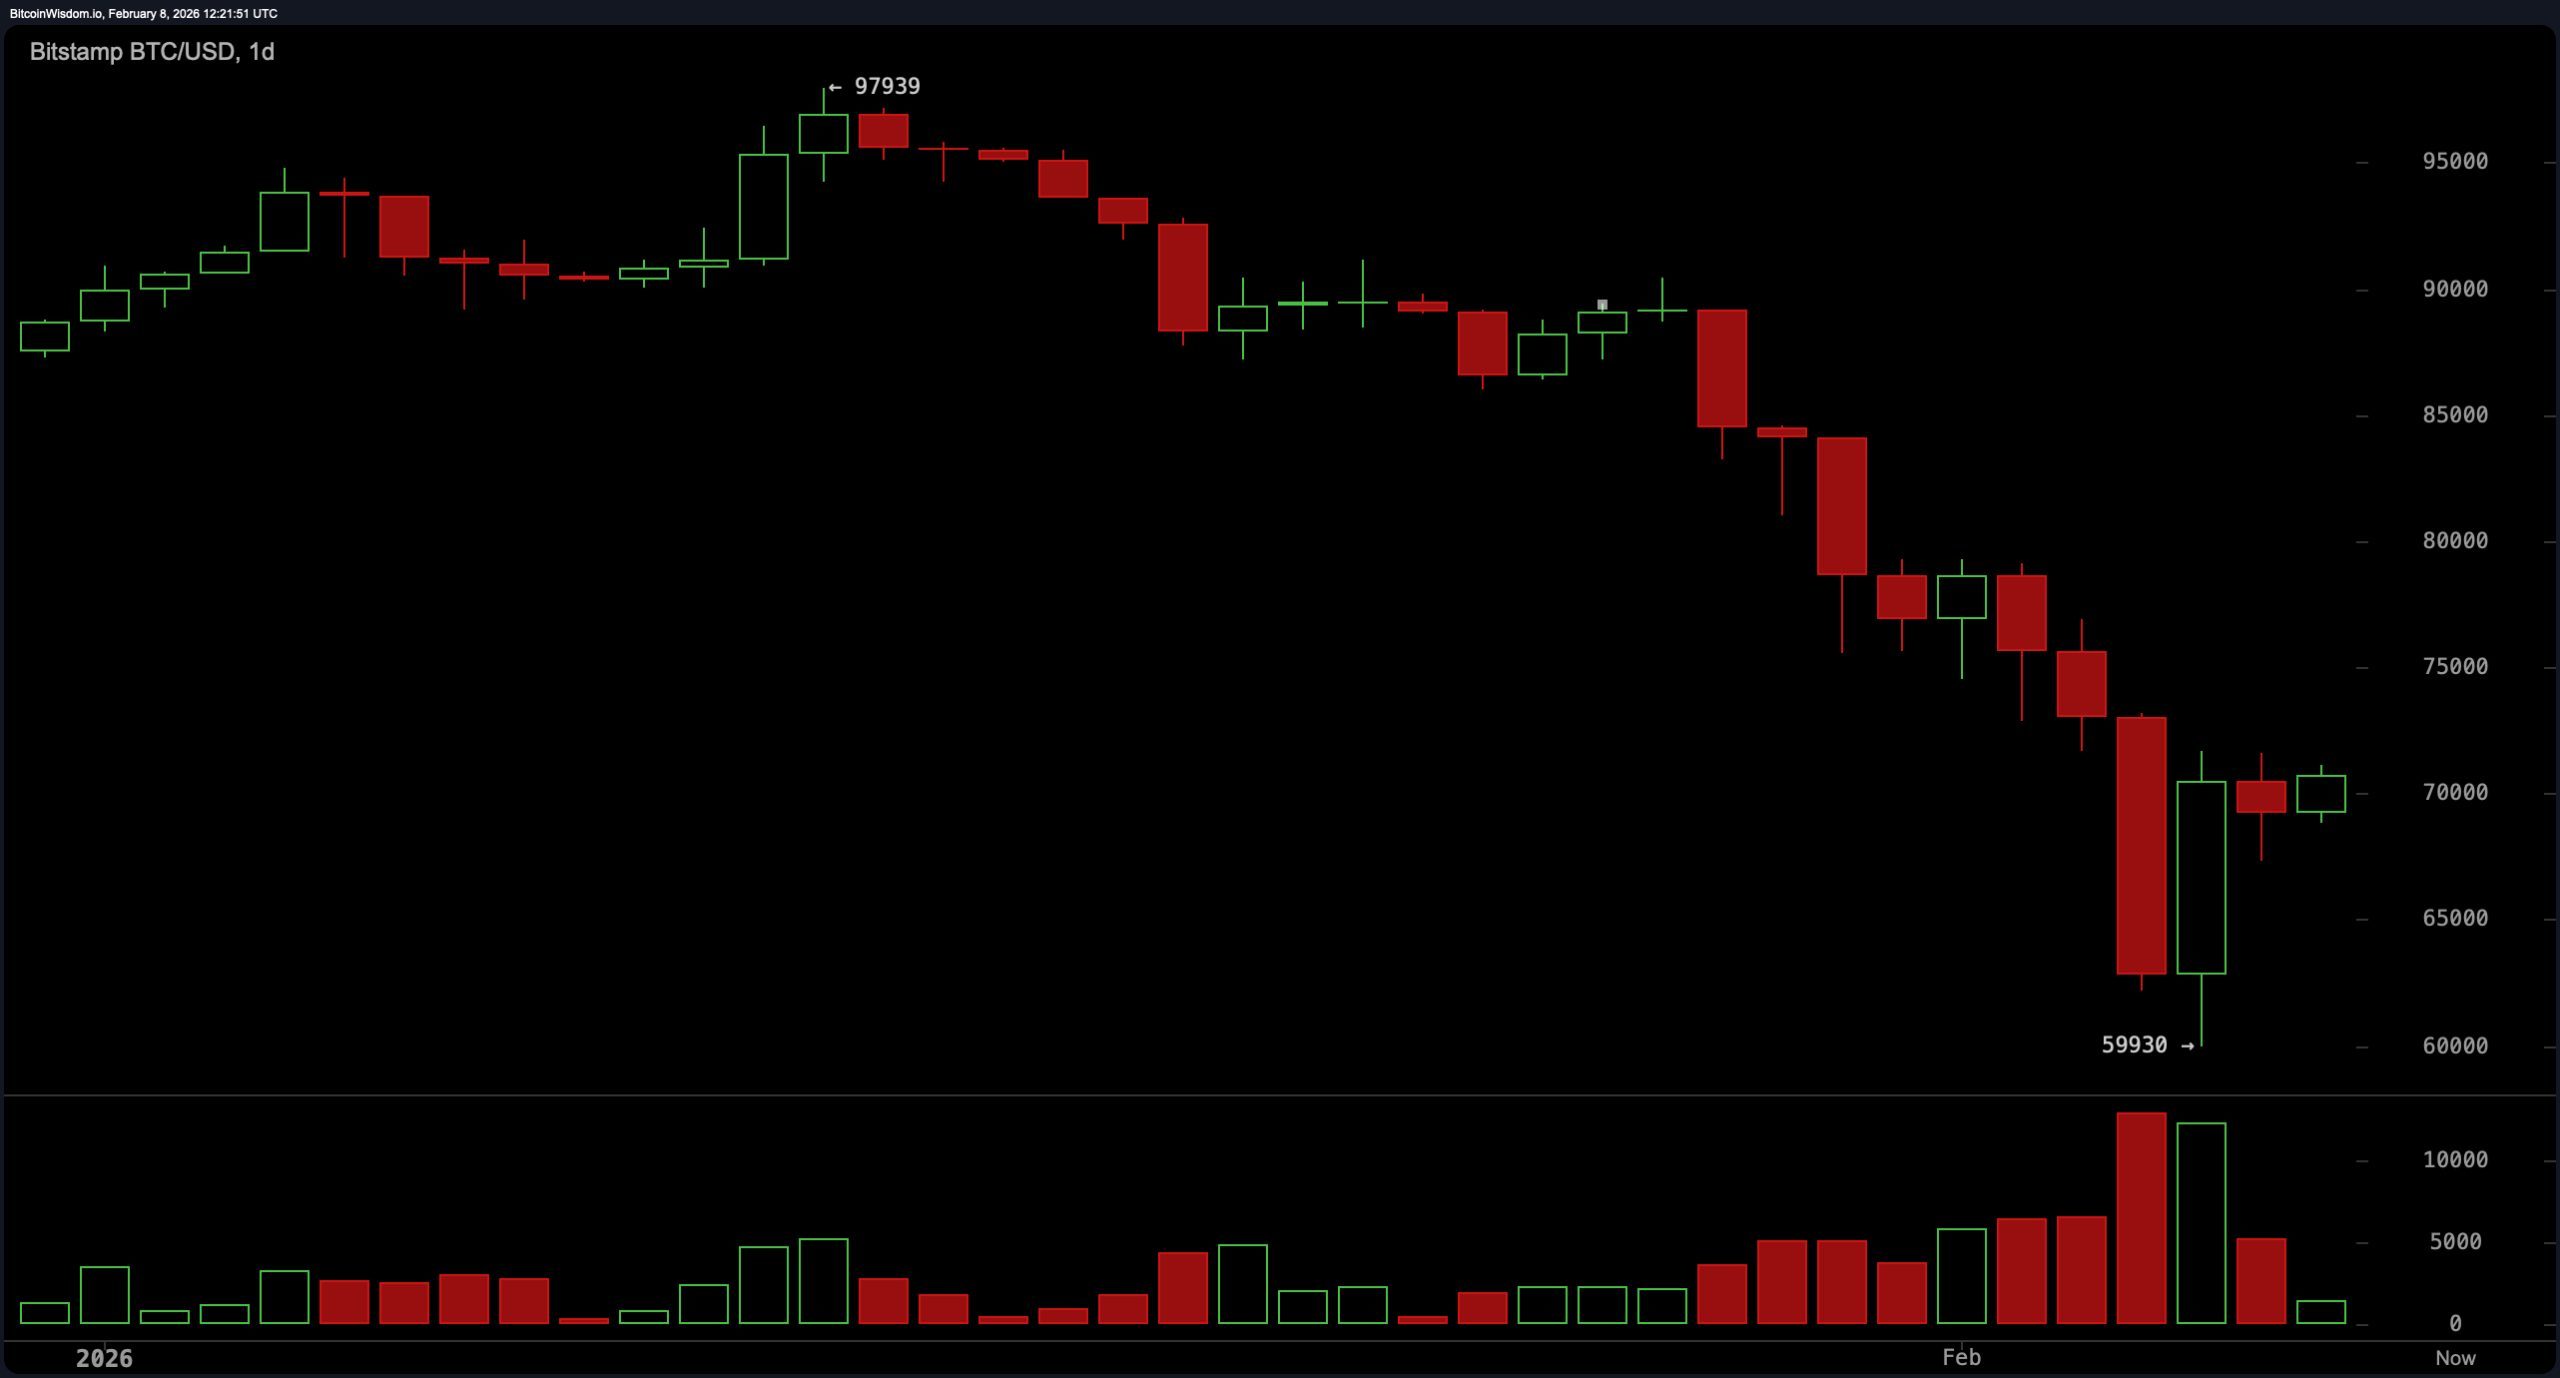
To the trained eye, the daily chart resembles the aftermath of a digital coronary. Bitcoin nosedived roughly 37% from near $95,000 to $59,930 earlier this year, slicing through support like a hot knife through HODLers’ dreams. While a relief rally has materialized, the broader trend remains unmistakably bearish, marked by lower highs, lower lows, and blood-red volume bars. This decline wasn’t just retail panic—liquidations north of $1 billion and macroeconomic jitters added fire to the fuse. Until bitcoin reclaims and sustains a position above $75,000, this bounce is guilty until proven innocent.
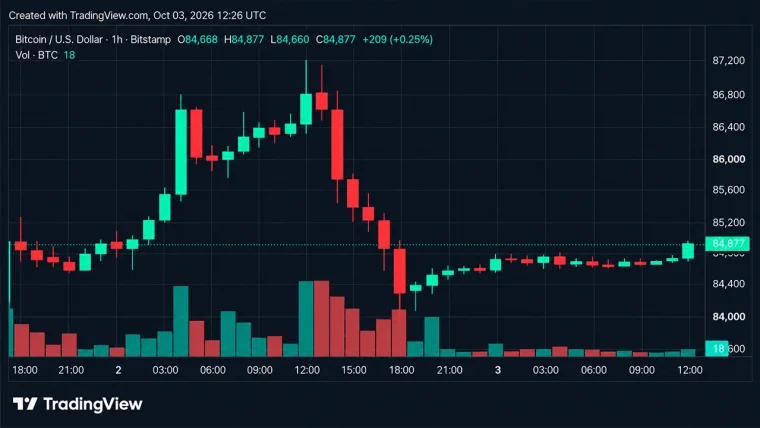
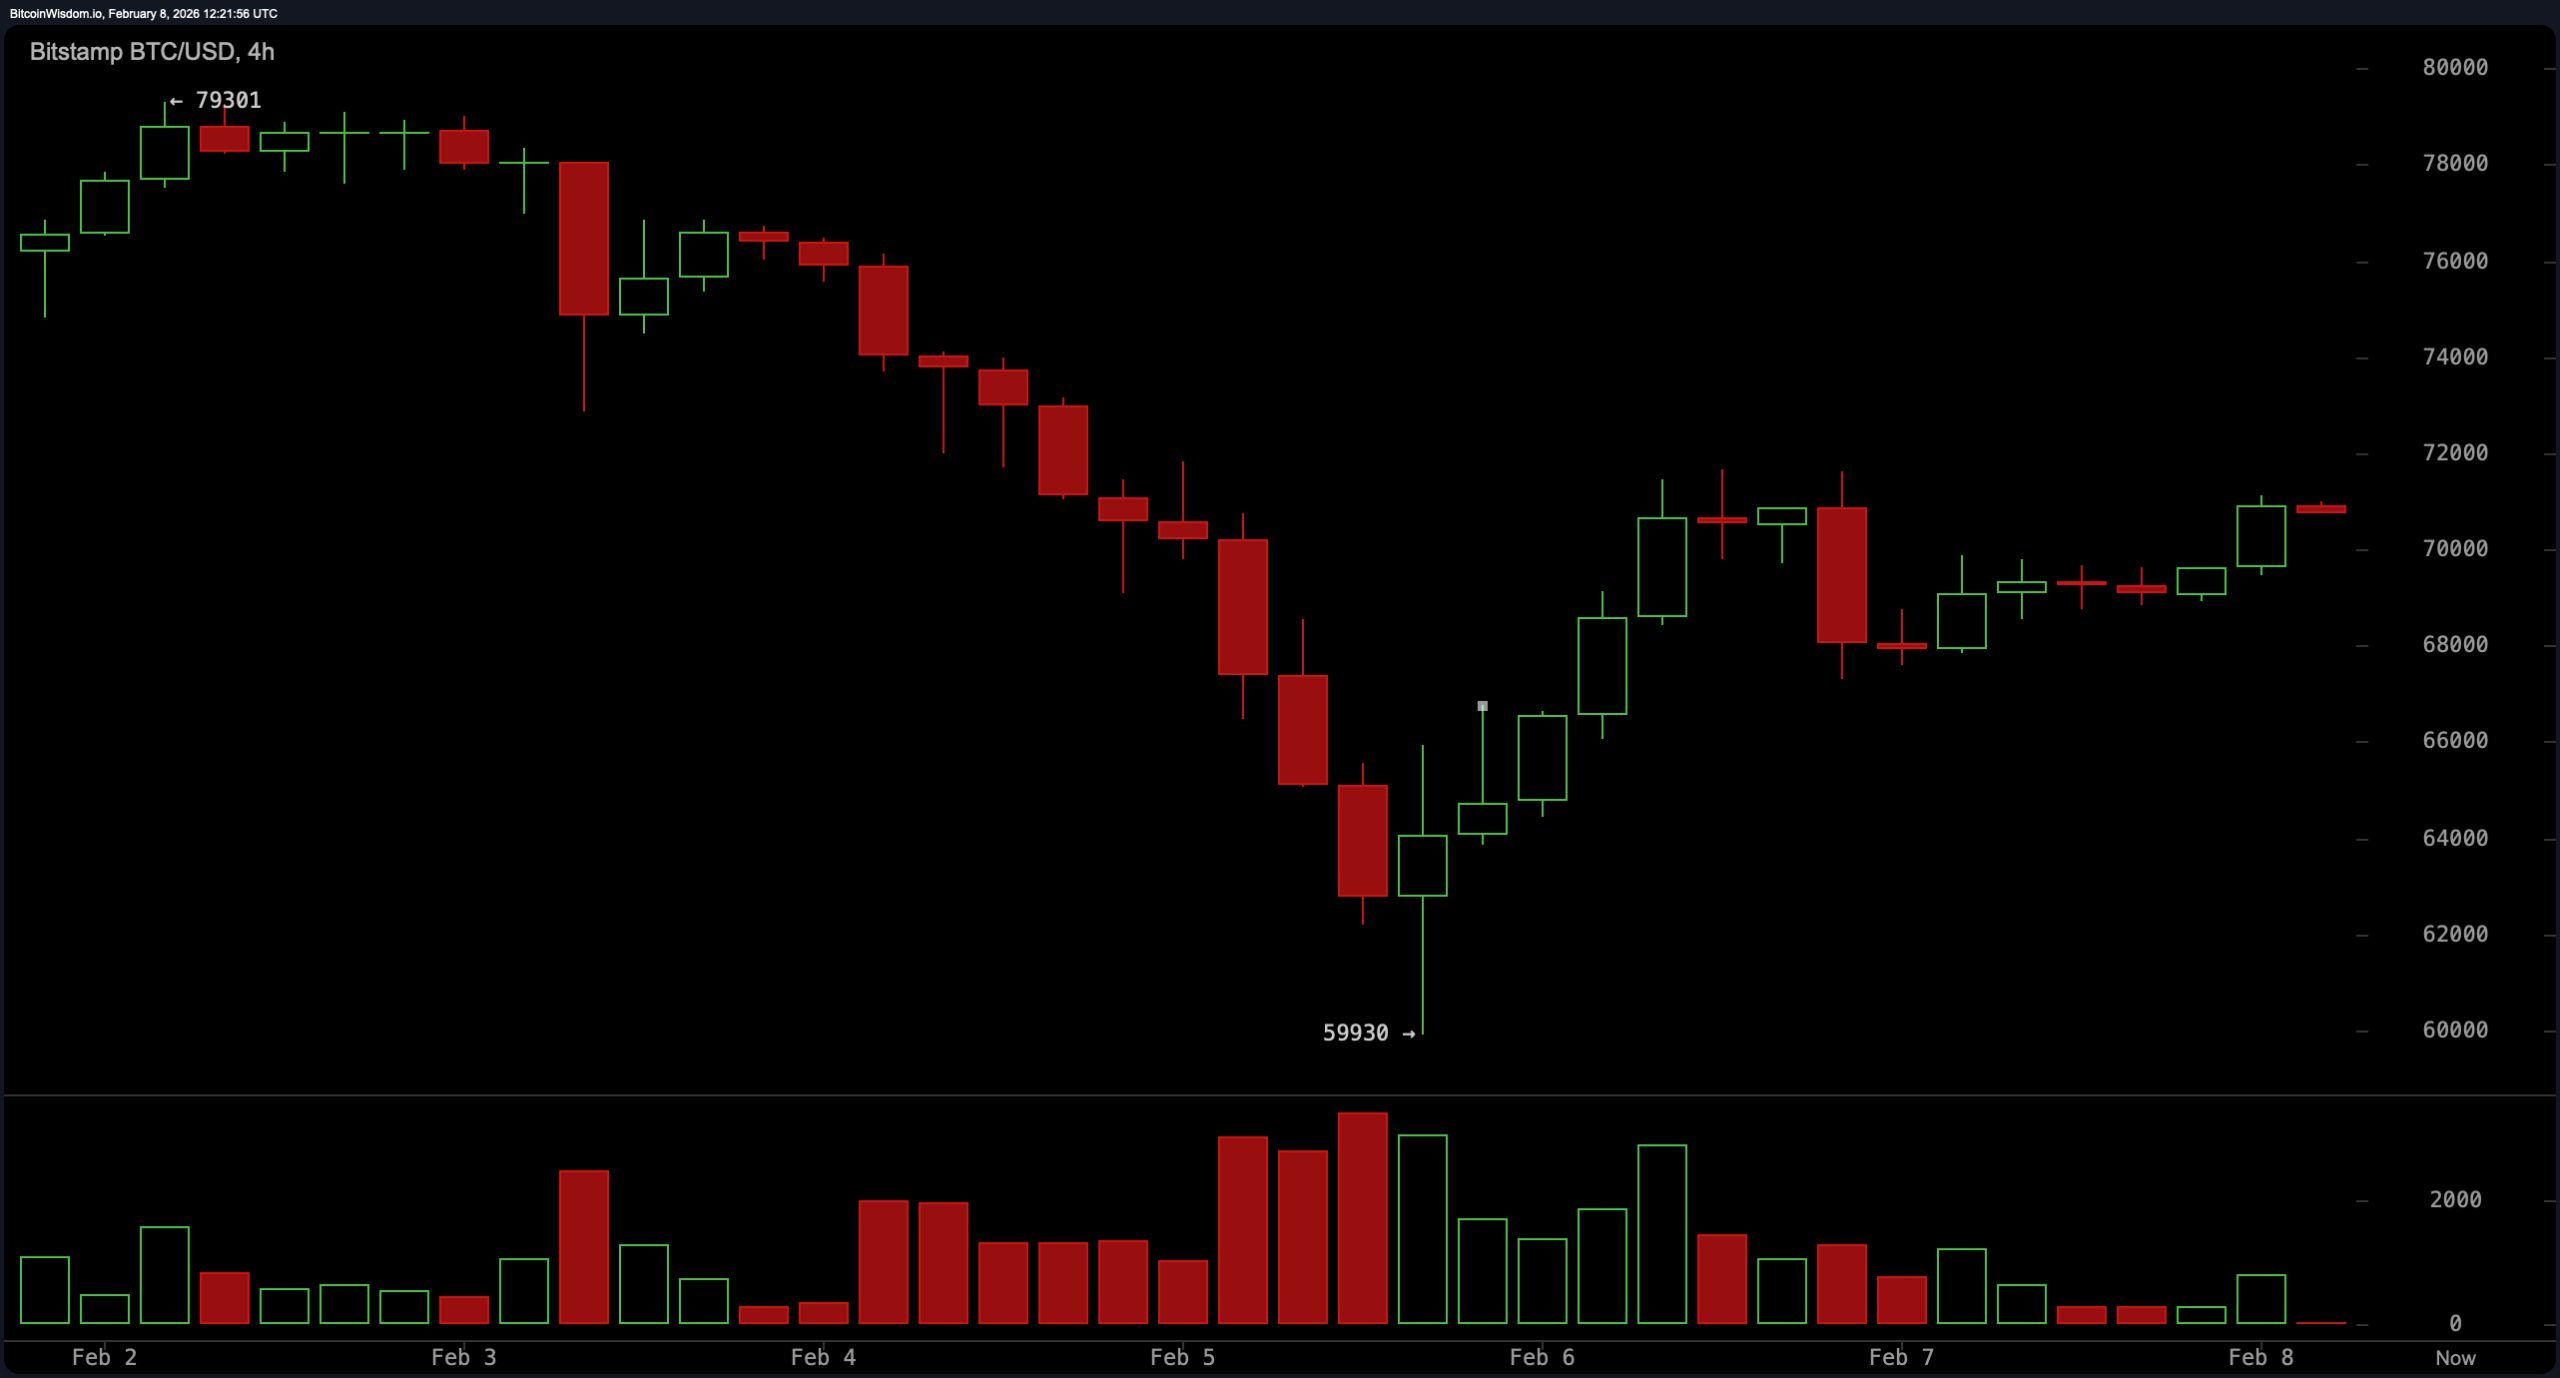
Zooming into the 4-hour chart, the recovery attempts look more like limp wrist flicks than a full-bodied swing. The price flounders below critical levels, struggling to hold $70,000, which now acts as a battleground rather than a bastion. Institutional shakeouts and mining difficulty adjustments have failed to stabilize the ship.
The candles tell a story of attempted rebounds met with swift rejection, painting a picture of a market unsure whether to cry, sleep, or rally. Traders eyeing entries around $60,000–$62,000 should monitor volume like hawks at a desert watering hole.
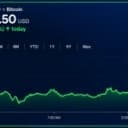
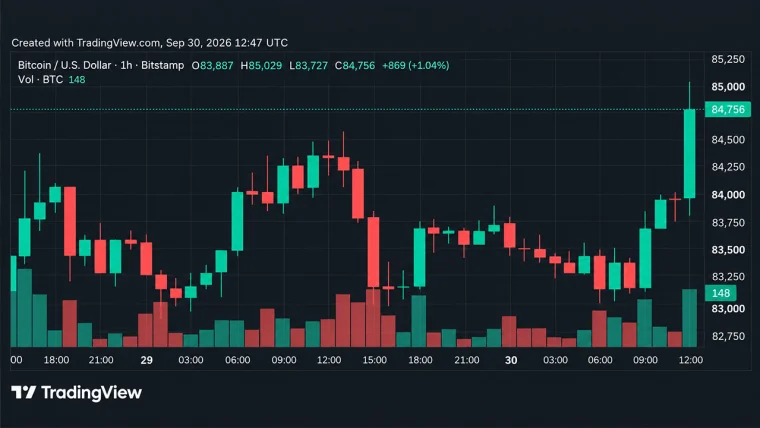
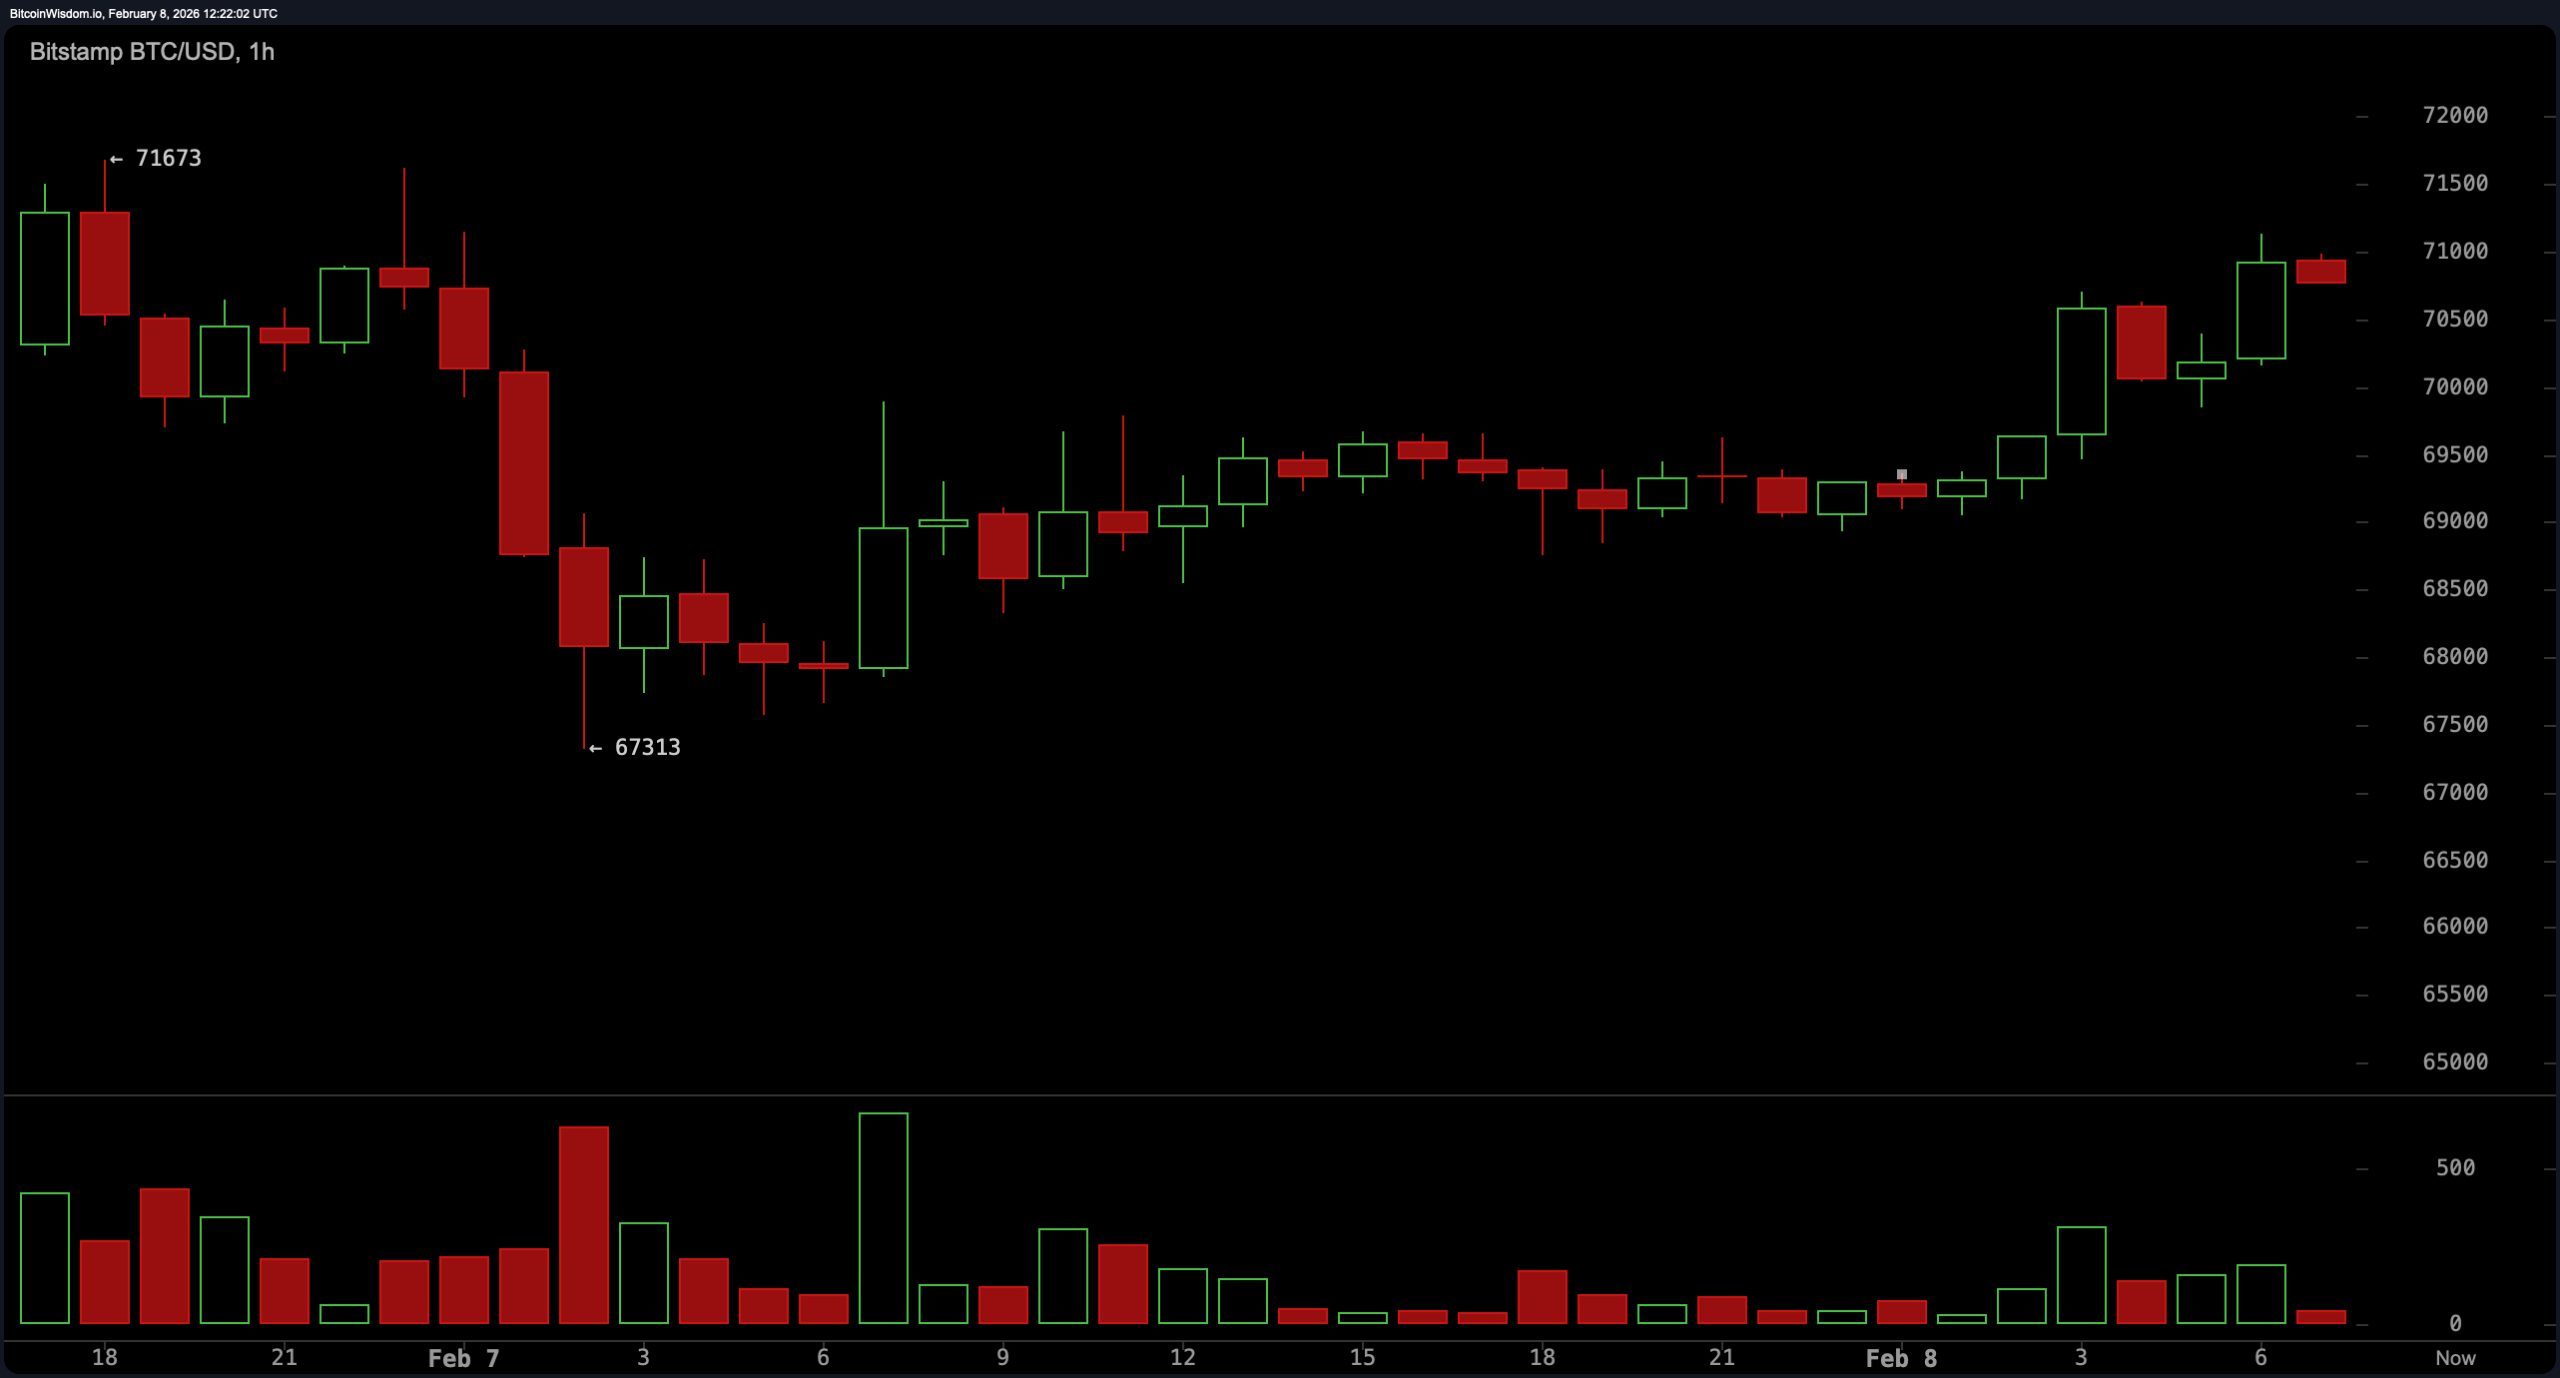
The 1-hour chart, on the other hand, hints at some short-term bullish swagger. A sharp climb from $67,313 to nearly $71,673 suggests someone is buying the dip—or at least pretending to. A series of higher lows confirms that short-term bulls are nibbling, but the key resistance at $71,673 remains the line in the sand. A clean break above could nudge the price toward $74,000, but anything less would reek of exhaustion. And let’s not forget: failure to hold $68,000 could reopen the trapdoor back to $59,930. Seatbelts recommended.
Indicators aren’t offering much of a pep talk either. Oscillators like the relative strength index (RSI), stochastic, commodity channel index (CCI), average directional index (ADX), and awesome oscillator are all throwing up neutral signals. Momentum may be whispering encouragement, but the moving average convergence divergence (MACD) is actively shaking its head with a bearish tilt.
The moving averages? Every single one from the 10-period to the 200-period—both simple (SMA) and exponential (EMA)—are firmly pointing south. If these were plane instruments, we’d be nose-diving into turbulence.
In sum, bitcoin’s price action today looks like a messy soap opera of panic, recovery, and indecision. Technicals across all timeframes suggest a battered asset attempting to find its footing while battling historical resistance and macro-level pessimism. The market has a pulse, but whether it’s a rebound or just a twitch remains to be seen. One thing’s for certain: this isn’t your grandma’s bull run.
Bull Verdict:
If bitcoin can break above $71,673 with conviction and volume, a run toward $74,000 or even $79,000 is on the table. Short-term momentum is quietly shifting, and higher lows on the 1-hour chart suggest the bulls aren’t extinct—just cautious and waiting for the right spark.
Bear Verdict:
With all major moving averages—both simple and exponential—pointing downhill and the moving average convergence divergence (MACD) stuck in the red, this bounce may be nothing more than a dead cat with a strong caffeine buzz. Unless $75,000 is reclaimed and held, the broader trend remains bearish, and a revisit of $60,000 support is a very real possibility.
FAQ ❓
- Where is bitcoin trading now?
Bitcoin is trading around $70,854 as of February 8, 2026. - What’s the short-term trend for bitcoin?
The 1-hour chart shows higher lows and short-term bullish momentum. - Is the overall bitcoin trend bullish or bearish?
The daily trend remains bearish, with resistance near $75,000. - What’s driving bitcoin volatility today?
Recent institutional selling and extreme fear are fueling sharp price swings.