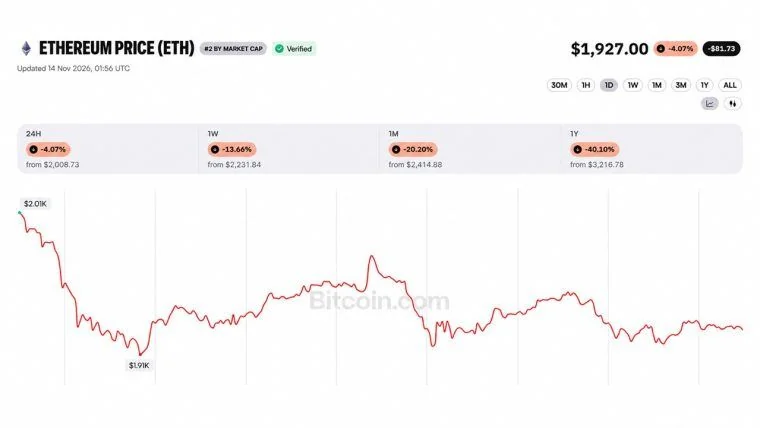



Ethereum’s price on May 27, 2024, stands at $3,908, reflecting a strong upward trend in the recent trading sessions. Ether’s intraday range has been between $3,795 to $3,953 over the past 24 hours.
Ethereum Technical Analysis: Bullish Signals Dominate as Ether Trends Higher

This article was published more than a month ago. Some information may no longer be current.
WRITTEN BY

SHARE

Ethereum
Ethereum’s 1-hour chart reveals a steady upward trend starting from May 26, peaking at approximately $3,953. After reaching this peak, the price is consolidating around the $3,880 to $3,900 levels. An increase in volume was observed during the initial upward movement, followed by a decrease during consolidation. A potential entry point could be identified if the price breaks above $3,953 with increased volume, indicating a continuation of the uptrend. Conversely, a break below the $3,900 support level with increased selling volume might signal a reversal or pullback.

The 4-hour chart supports the observations from the 1-hour chart, highlighting a clear uptrend beginning around May 23, followed by consolidation. Key support is identified at $3,600, with resistance at the recent peak of $3,953. Volume analysis shows strong buying interest during the initial upward movement, with volume tapering off during consolidation. A sustained break above the $3,953 resistance level with increased volume could serve as an entry signal, while a drop below the $3,600 support level with high volume might suggest an exit.

On the daily chart, ethereum has exhibited a strong bullish trend from the beginning of May, with the price rising from around $2,813 at the start of the month, to a recent high of $3,953. The price action indicates consolidation around the $3,900 level, suggesting potential support. Significant volume spikes during major price moves indicate strong market participation. A break and hold above $3,953 with strong volume could signal the continuation of the bullish trend. However, a drop below the $3,600 level on the daily chart with high volume might indicate a deeper correction and an exit point.
Oscillator analysis provides mixed signals: the relative strength index (RSI) at 72.2 and the Stochastic at 89.0 suggest a neutral stance, while the commodity channel index (CCI) at 112.2 indicates a bearish signal. Conversely, the awesome oscillator at 569.8 and the moving average convergence divergence (MACD) level at 198.1 both suggest a bullish signal, highlighting the ongoing momentum.
Moving averages (MAs) across various timeframes further reinforce the bullish outlook. All major exponential and simple moving averages (EMA & SMA), including the 10, 20, 30, 50, 100, and 200 periods, indicate bullish signals. This comprehensive alignment of moving averages suggests a strong underlying bullish trend, providing additional confidence in the upward trajectory of ethereum’s price.
Bull Verdict:
Ethereum’s technical indicators and price actions suggest a strong bullish trend. With all major moving averages indicating bullish signals and significant support at the $3,900 level, ethereum appears poised for further gains. Investors should look for breakouts above key resistance levels for potential entry points.
Bear Verdict:
Despite the bullish indicators, there are some cautionary signals from the oscillators, particularly the commodity channel index (CCI) and Momentum indicators, which suggest potential overbought conditions. A drop below the critical support level of $3,600 with high volume could signal a deeper correction, warranting caution for those holding long positions.
Register your email here to get weekly price analysis updates sent to your inbox:
What do you think about ether’s market action on Monday? Share your thoughts and opinions about this subject in the comments section below.
About the author
WRITTEN BYJamie RedmanNews Lead
Jamie Redman is the News Lead at Bitcoin.com News and a financial technology journalist based in Massachusetts.