Ethereum’s price stands at $4,403 on Aug. 12, 2025, at 10:45 a.m. Eastern time, supported by a market capitalization of $530.27 billion and a 24-hour trading volume of $43.98 billion. The day’s intraday range spanned $4,196 to $4,435, underscoring heightened volatility as traders tested key resistance levels.
Ethereum Price Watch: Ether Bulls Focus in on $4,500 as Market Momentum Builds
This article was published more than a month ago. Some information may no longer be current.
WRITTEN BY
SHARE

Ethereum
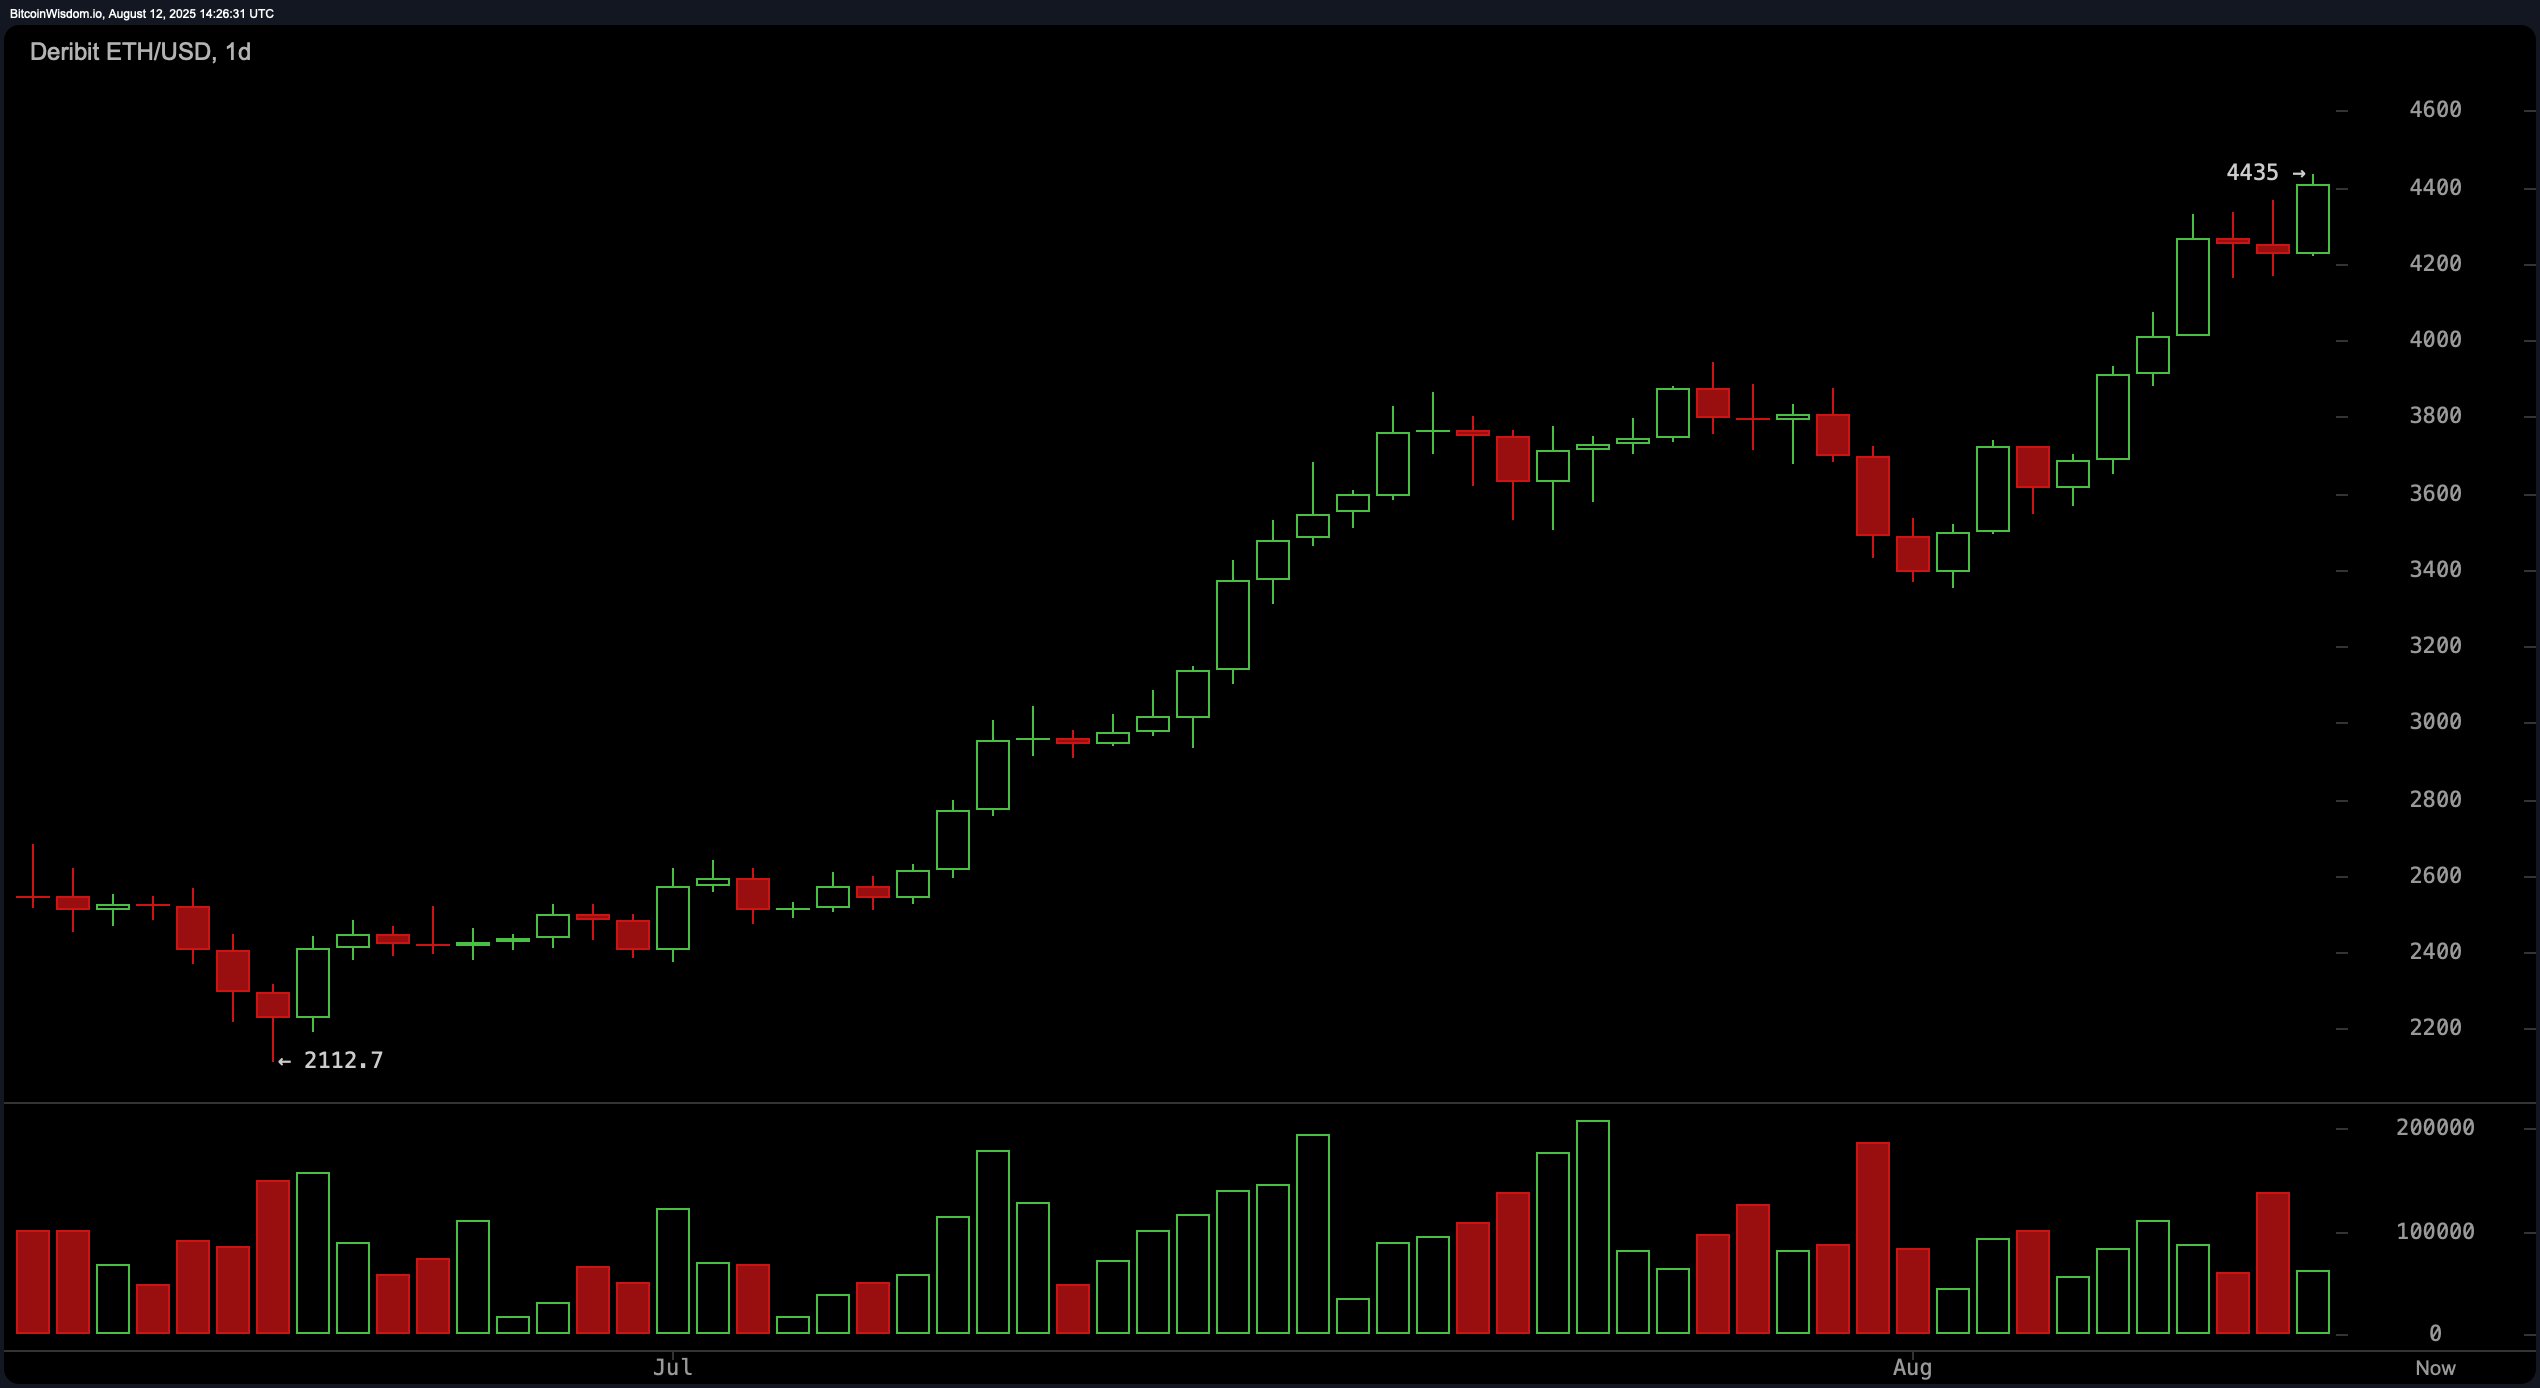
On the daily chart, ethereum (ETH) maintains a robust bullish trend, with the price having surged from approximately $2,112 to its recent high of $4,435. Higher highs and higher lows reinforce the upward trajectory, but small-bodied candles near the top hint at short-term indecision. The $4,000 level remains a strong support zone, while $4,435 serves as the immediate resistance. A consolidation phase or minor retracement is likely before another breakout attempt, especially as momentum indicators such as the moving average convergence divergence ( MACD) level and momentum both signal buying strength.
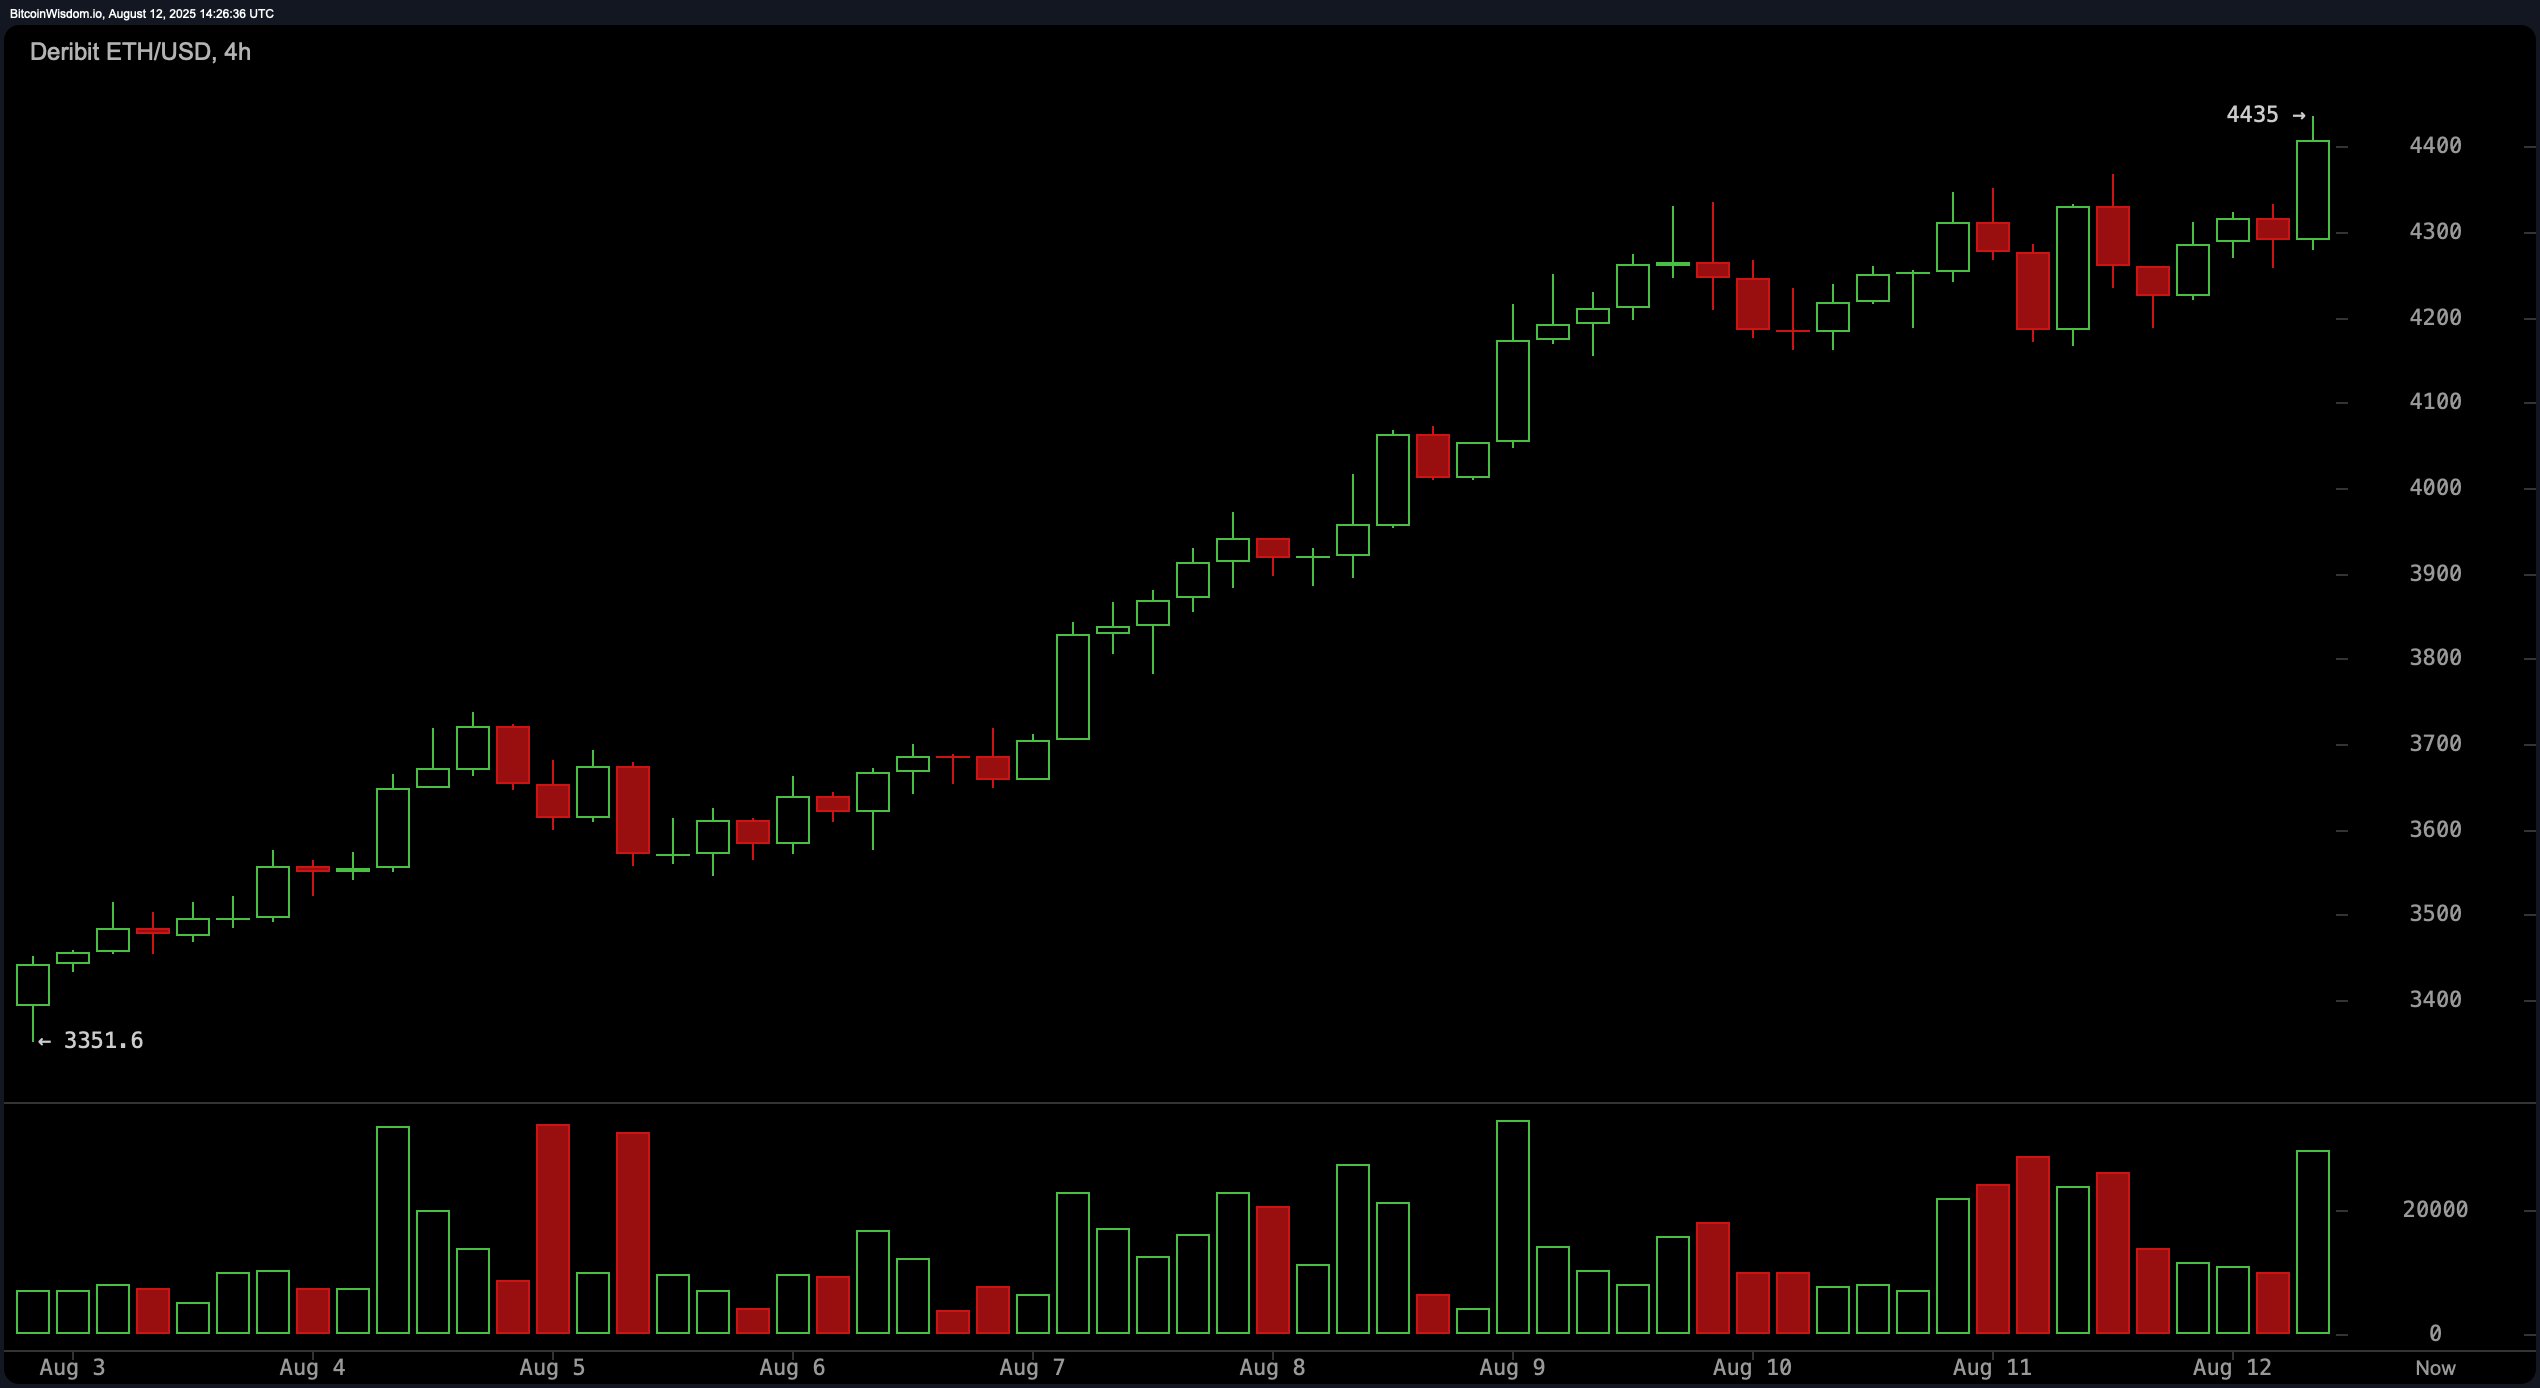
The 4-hour ethereum chart shows a strong rally from $3,351 to $4,435, with a critical breakout above $4,300 triggering increased buy volume. This move suggests active bullish participation, yet the price may revisit the $4,300–$4,320 range to confirm it as support. If buyers defend this area, the path toward retesting and possibly breaching $4,435 strengthens. The exponential moving averages (EMA) and simple moving averages (SMA) across all periods, from 10 to 200, remain firmly in buy territory, reinforcing the bullish bias.
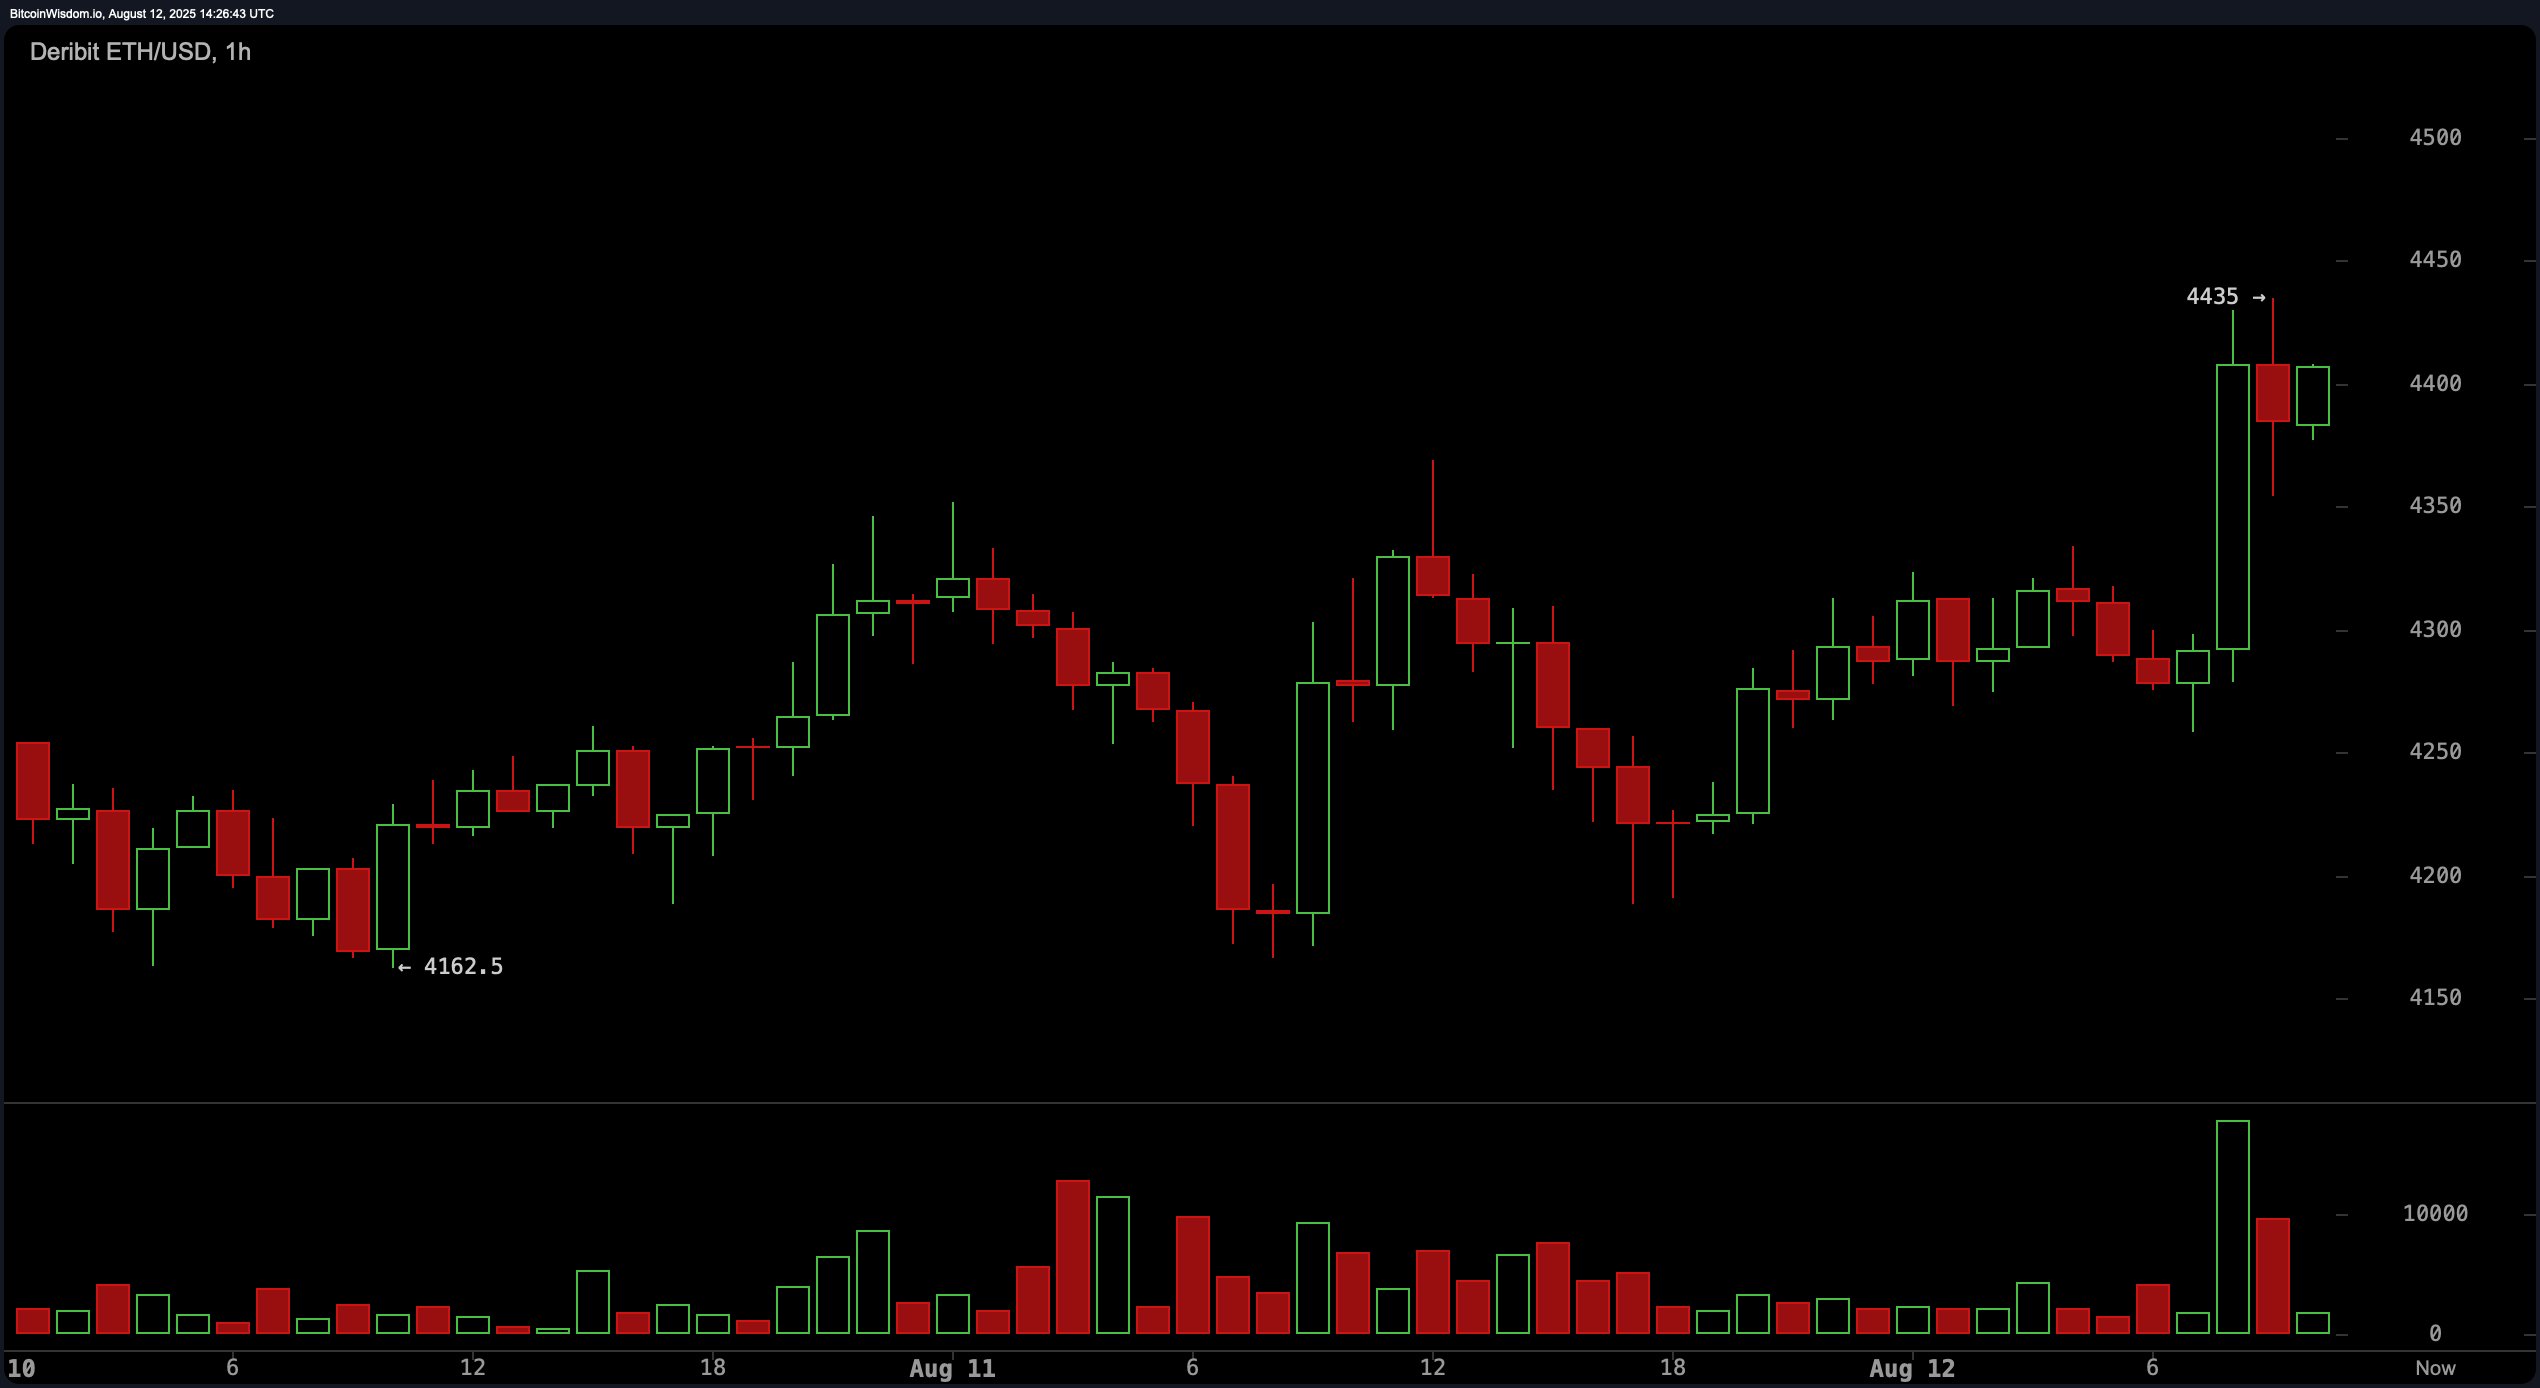
On the 1-hour chart, ethereum experienced a rapid push to $4,435, followed by moderate profit-taking. A large green candle accompanied by high volume highlighted aggressive buying interest, though sellers quickly emerged at resistance. The consolidation that followed suggests intraday traders are waiting for a decisive breakout. A clean move above $4,435, backed by volume, could trigger momentum plays toward the psychological $4,500 mark, while failure to hold could prompt short-term retracements.
Oscillators present a mixed picture. The relative strength index ( RSI) at 74.8 and stochastic at 91.6 both register as neutral, reflecting an overextended but not yet exhausted rally. The commodity channel index (CCI) at 178.1 signals a sell, suggesting caution in the short term, while the average directional index (ADX) at 43.8 shows a strong trend without directional clarity. Momentum at 1,007.5 and the MACD level at 254.9 both indicate buying pressure, aligning with the overarching bullish structure.
From a strategic standpoint, the bias remains upward across all timeframes, but $4,435 is a pivotal inflection point. Swing traders may look for long entries on a confirmed pullback to $4,300, while scalpers could position for rapid gains on a breakout above resistance. Risk management remains critical, with stops placed below $4,300 for swings and just under breakout lows for scalps, given the elevated volatility in the market.
Bull Verdict:
Ethereum’s multi-timeframe bullish structure, strong support at $4,300, and consistent buy signals from both exponential moving averages (EMA) and simple moving averages (SMA) suggest that the asset is well-positioned for another leg higher. A confirmed breakout above $4,435 could quickly open the path toward the $4,500 psychological level and beyond.
Bear Verdict:
Despite the prevailing uptrend, the commodity channel index (CCI) sell signal, overextended oscillators, and resistance pressure at $4,435 raise the risk of a near-term pullback. Failure to hold above $4,300 could invite deeper profit-taking toward the $4,000 support zone.