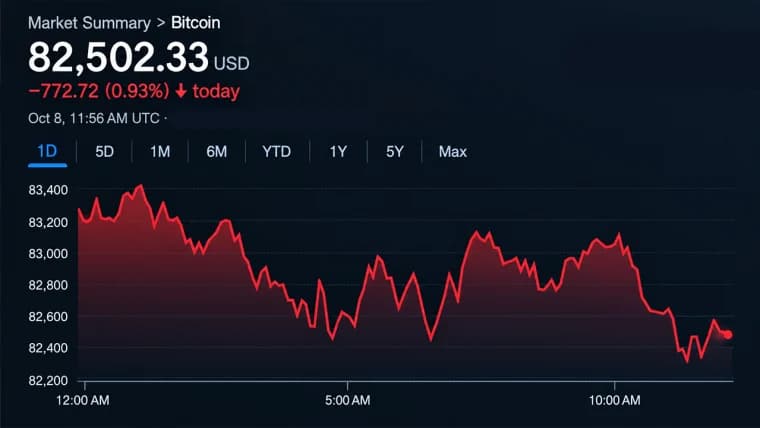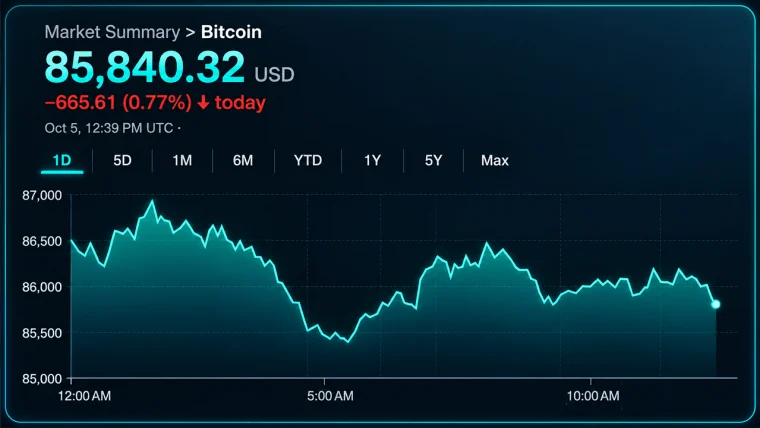



Bitcoin, the digital darling of financial disruption, clocked in at a price of $88,199 on Wednesday, Jan. 21, 2026. The crypto asset’s market cap stood at a formidable $1.77 trillion, backed by a 24-hour trading volume of $58.07 billion. With an intraday range stretching from $87,777 to a high-flying $91,201, bitcoin flirted with both danger and opportunity — the kind of volatility that gets chart-watchers reaching for their Fibonacci tools before their coffee.
Bitcoin Teeters at $88K as Bulls and Bears Lock Horns in a Volatile Showdown

This article was published more than a month ago. Some information may no longer be current.
WRITTEN BY

SHARE

Bitcoin Chart Outlook
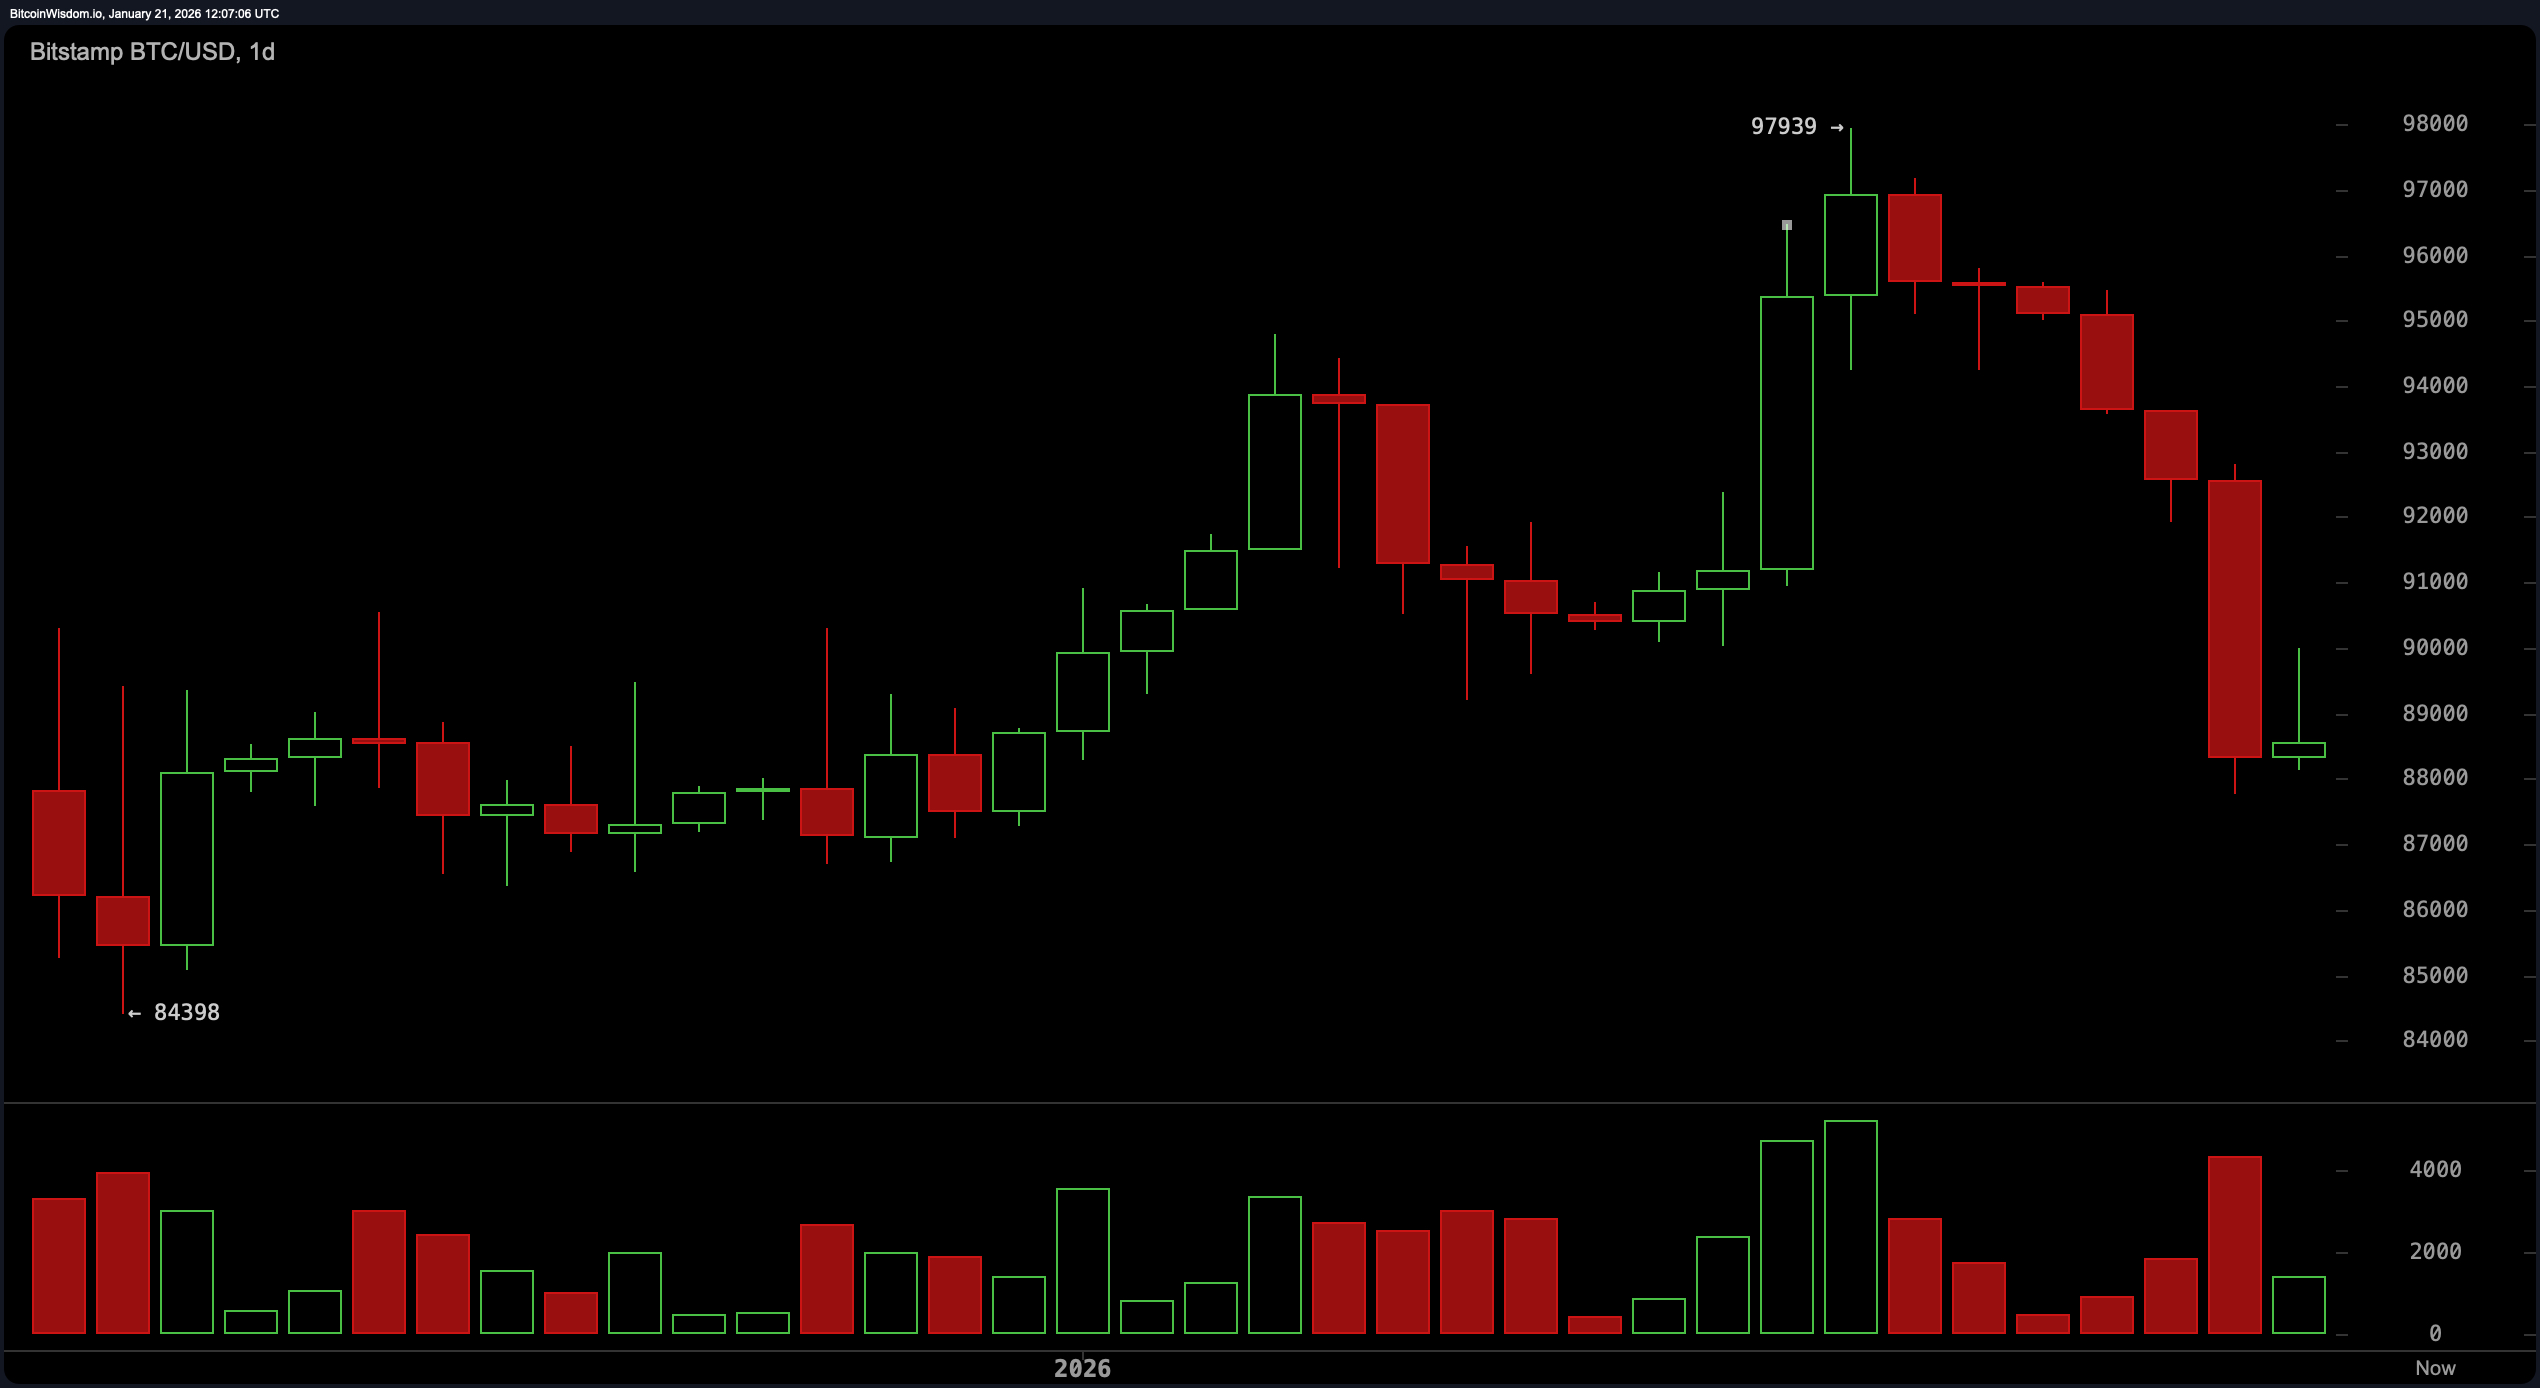
On the daily chart, bitcoin has clearly exited its parabolic sprint and taken a detour into a sobering correction phase. A recent peak around $97,939 is now a distant memory as the price settled closer to $88,000, where a long lower wick signals potential support amid seller exhaustion.
The uptick in volume on a sharp red candle hints at panic-driven liquidation, not strategic exits. Bearish engulfing patterns on this timeframe are throwing shade on bullish hopes, but the long tail suggests dip-buyers are still lurking. If the price consolidates with narrowing candles above this support and declining volume, a return to the $92,000–$94,000 resistance region remains plausible.
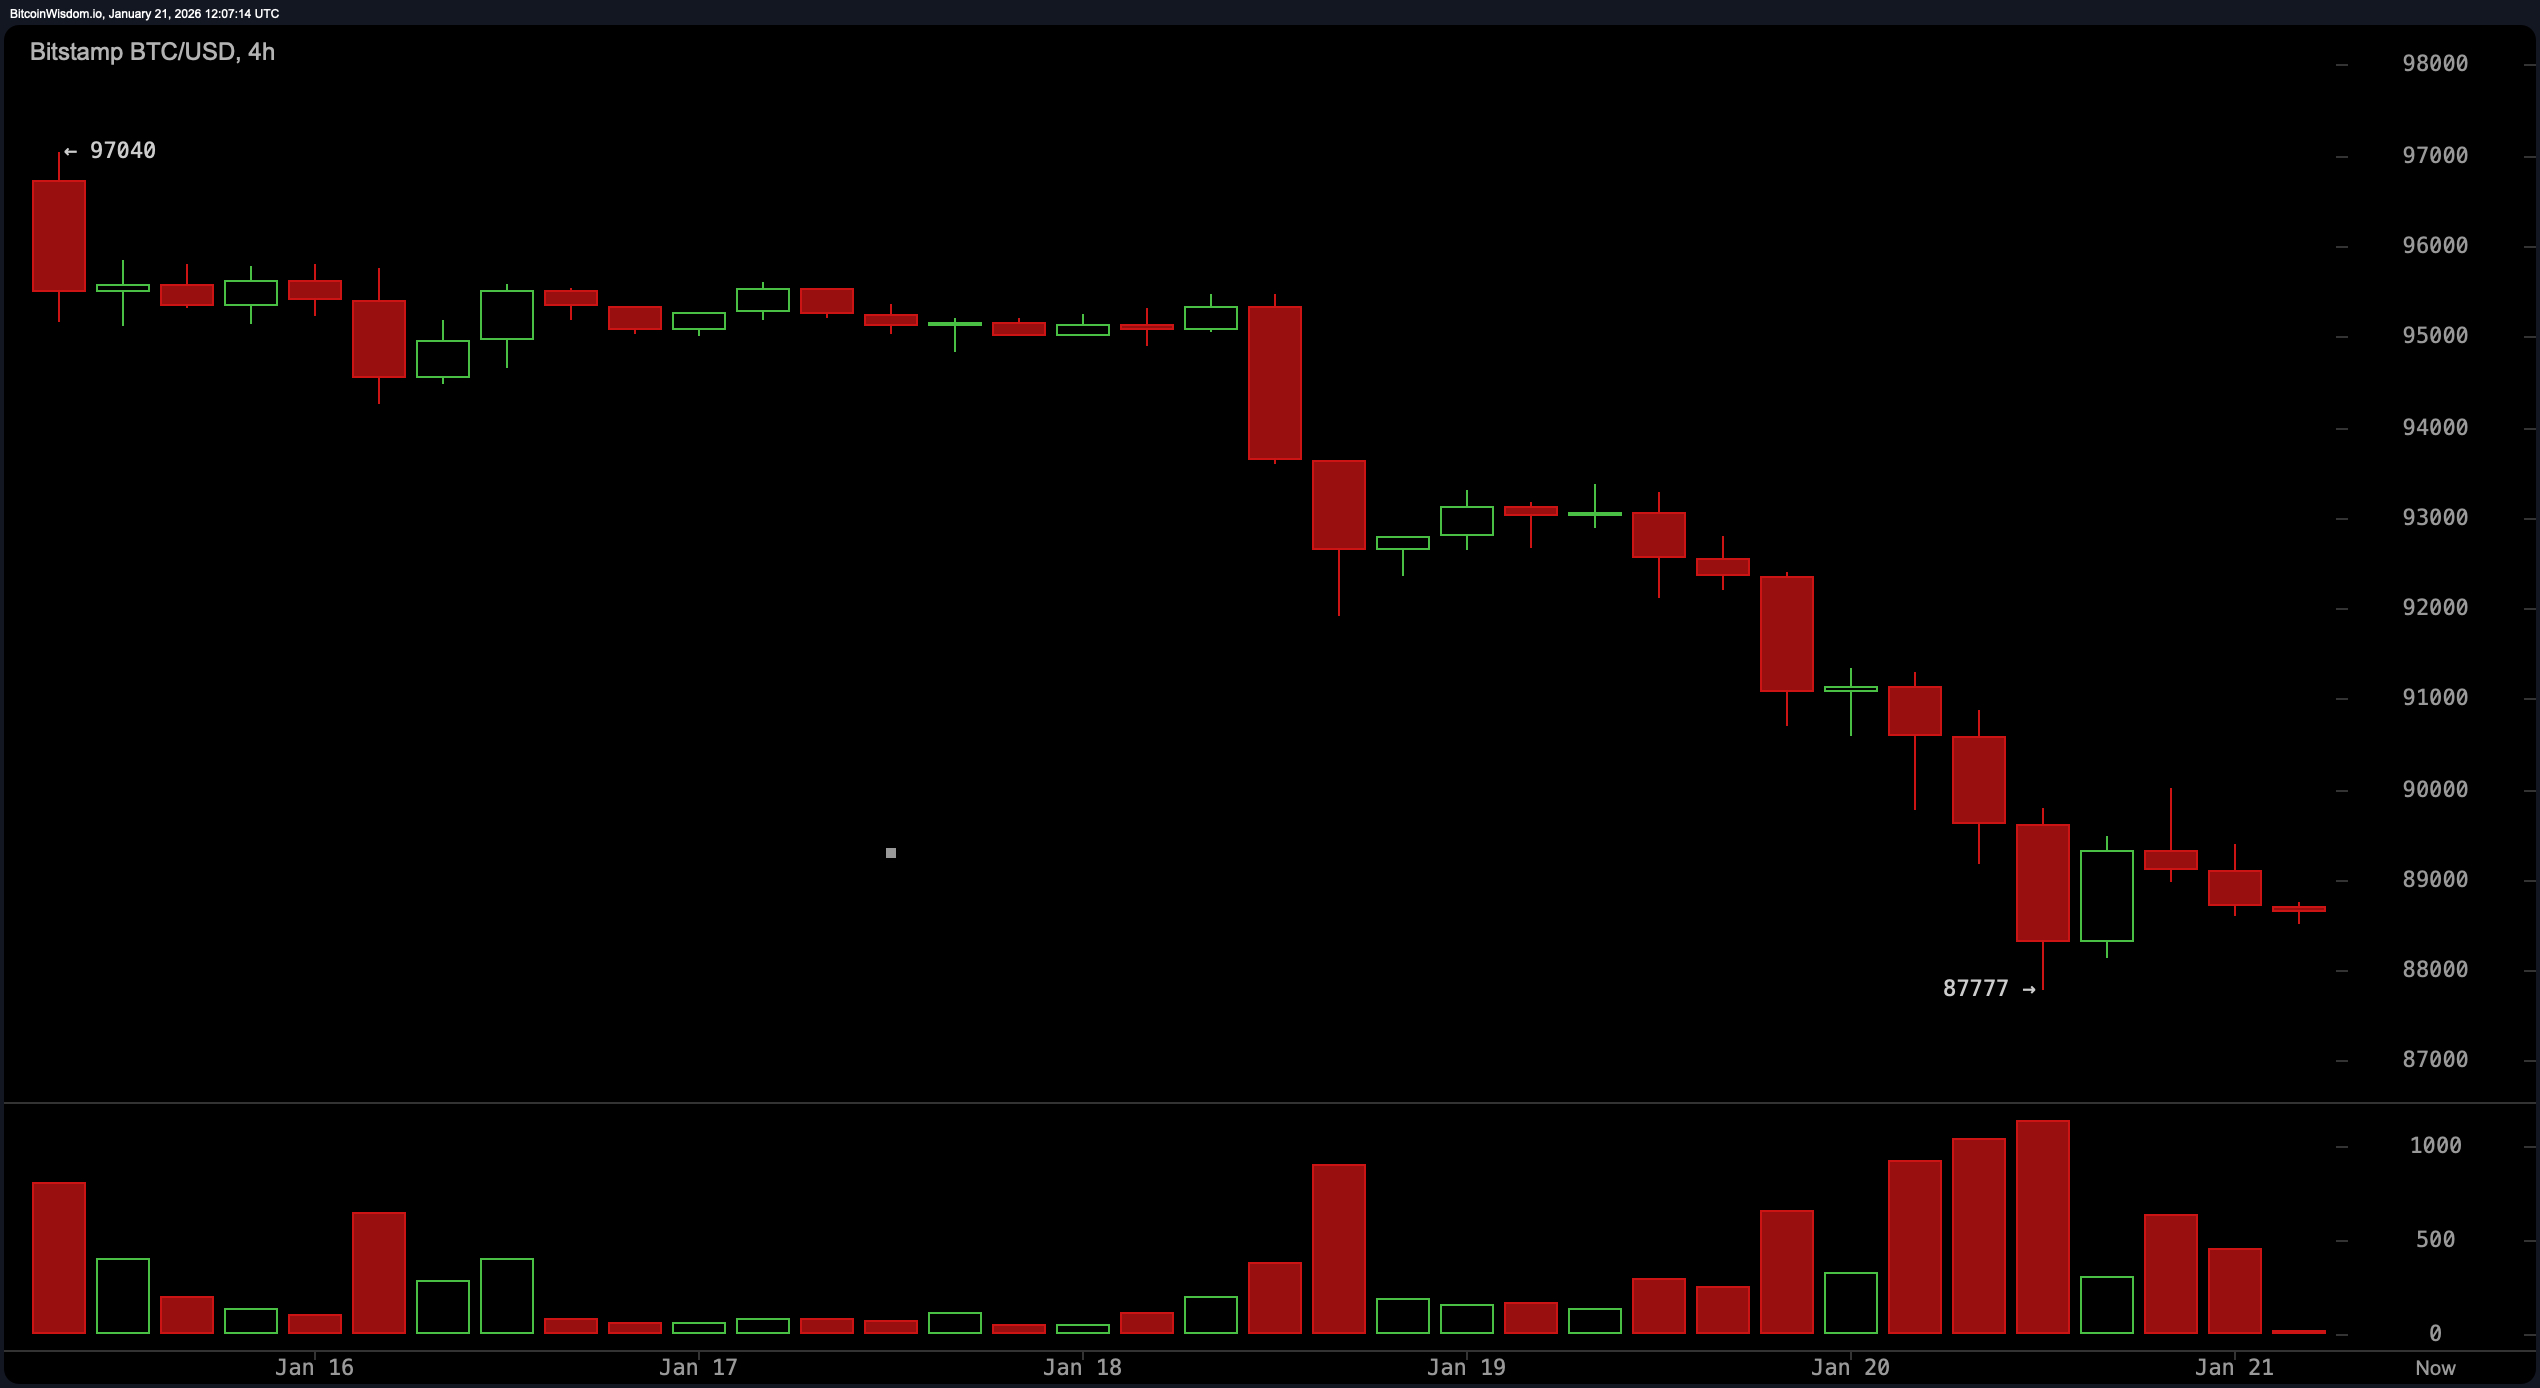
The four-hour chart tells a more somber tale, complete with textbook lower highs and lower lows—classic symptoms of a bearish grip. A temporary reprieve emerged at the $87,777 mark, yet red volume bars assert dominant selling pressure. Still, the recent fade in bearish momentum may offer temporary respite if a double bottom or a higher low above $88,500 forms. Any decisive move above $90,000 could target $91,500–$92,000, but without a strong reclaim, a retreat toward $87,000 remains on the table. The chart is whispering caution louder than a Wall Street analyst during earnings season.
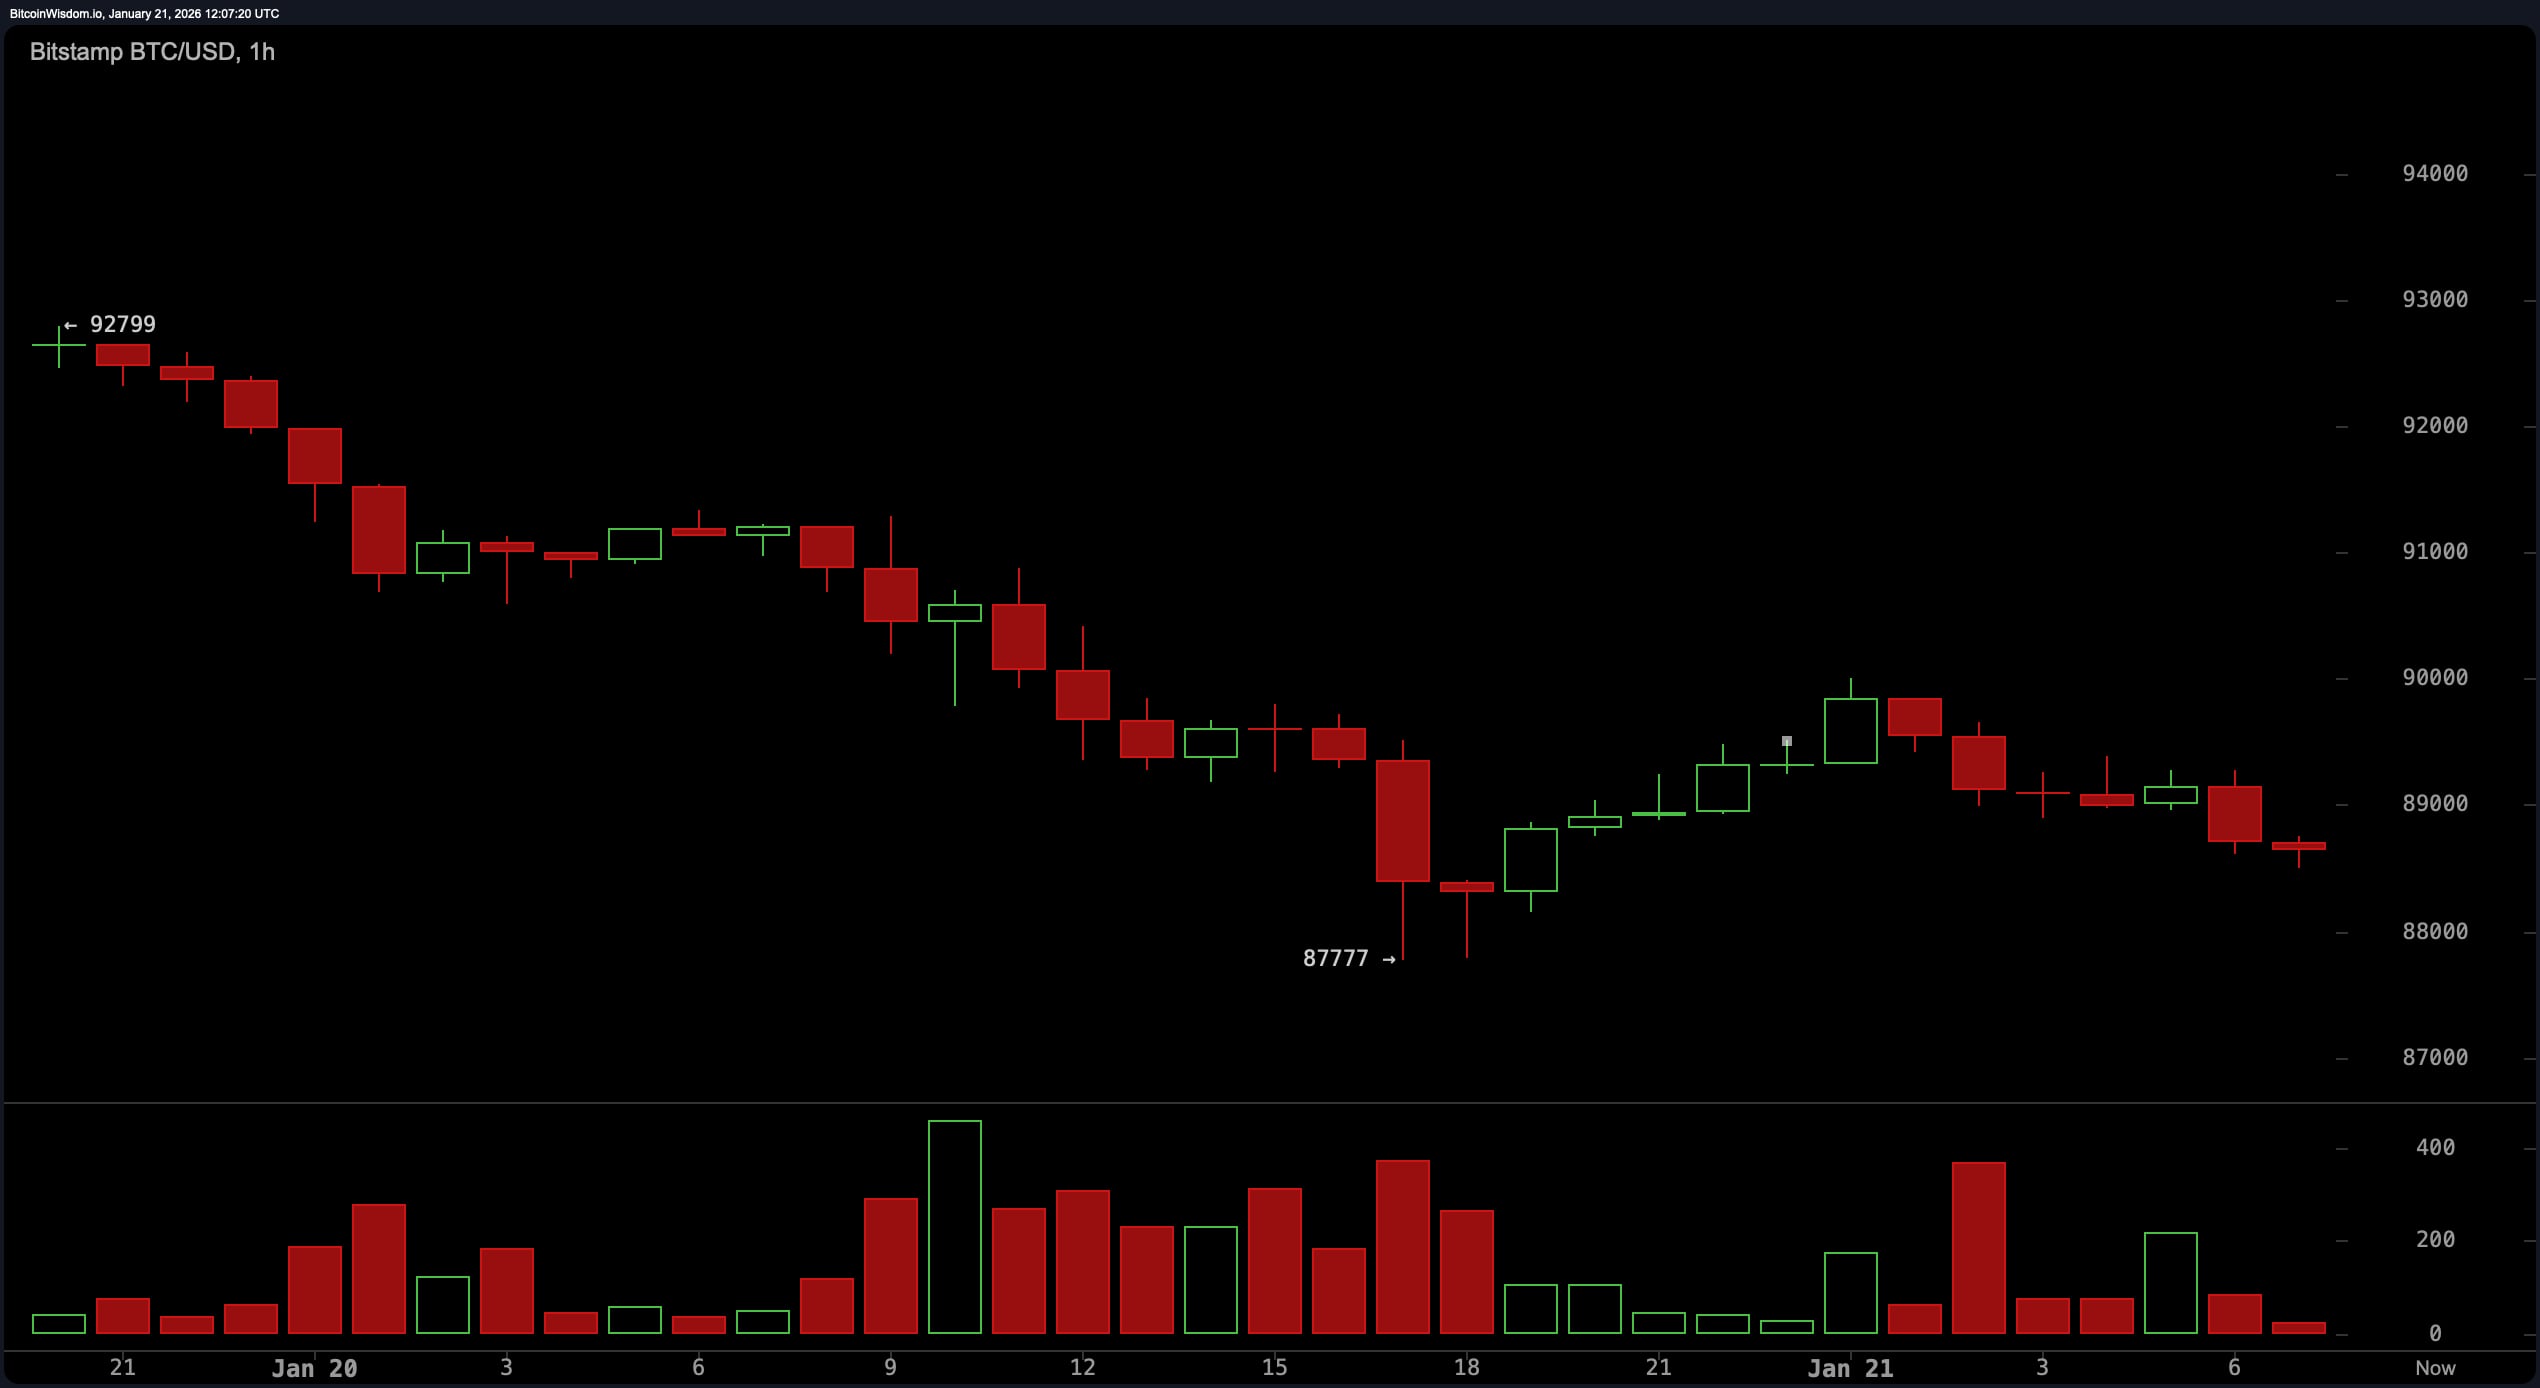
Zooming in to the one-hour timeframe, the market appears to be writing a suspenseful script, coiling into a descending triangle or perhaps a classic bear flag. The bounce from $87,777 lacked the celebratory volume needed to spark real confidence. Green candles appeared, sure — but without the volume to throw a party, they’re just noise. If $88,000 holds and price cracks through $89,000 with momentum, a quick push to the $90,000–$91,000 region is conceivable. But if bitcoin breaks south of $88,000 with conviction, targets between $85,500 and $86,000 come sharply into focus.
The oscillators on Wednesday are also showing their poker faces. The relative strength index (RSI) holds at 41, the stochastic oscillator at 17, and the commodity channel index (CCI) deep in negative territory at −112 — all signaling neutrality. The average directional index (ADX) sits at 30, indicating a trend with some muscle, though not yet a powerlift. The awesome oscillator echoes neutrality, while the momentum indicator and the moving average convergence divergence (MACD) level flash warnings with negative readings, hinting at latent bearish undertones. In this environment, momentum traders should mind the exits — and maybe double-check their stop losses.
The moving averages? They’re not here to comfort anyone. All tracked moving averages — including exponential moving average (EMA) and simple moving average (SMA) over 10, 20, 30, 50, 100, and 200 periods — are stacked against bullish narratives. The 10-period EMA at $91,912 and the 10-period SMA at $93,289 are both trading well above current price, reinforcing downside pressure. The 200-period EMA and SMA stretch as far as $99,126 and $105,535, respectively, giving bitcoin bulls a very long road ahead if they hope to reclaim dominance. For now, the trend is not their friend — it’s their probation officer.
Bull Verdict:
If $88,000 holds firm and bitcoin musters enough volume to breach $89,000, momentum could shift toward the $90,000–$94,000 resistance corridor. This setup would align with a bounce from critical daily support and short-term exhaustion in selling pressure, offering traders a textbook recovery play. But without follow-through, it’s just another head fake in a volatile market — so bullish optimism must be paired with tactical discipline.
Bear Verdict:
The structure remains precariously tilted toward further downside, with every major moving average towering above the current price like bearish sentinels. Should bitcoin crack below $88,000 with volume, the next stop could be the $85,500–$86,000 range, confirming a breakdown from current consolidation patterns. Until key resistance levels are decisively reclaimed, the bears keep the upper hand — smug and chart-compliant.
FAQ 🐂 🐻
- What is the current price of bitcoin?
Bitcoin is trading at $88,199 as of Jan. 21, 2026, at 7:30 a.m. EST. - What key support level should traders watch?
The $88,000 level is acting as critical short-term support. - Where is the next major resistance for bitcoin?
Resistance is building around the $90,000 to $94,000 range. - Is bitcoin in a bullish or bearish trend right now?
Current indicators point to a bearish trend with weak recovery signals.