Bitcoin is currently valued at $104,810 to $104,987 over the past 60 minutes, with a 24-hour trading volume of $18.20 billion and a total market capitalization of $2.07 trillion. The intraday price oscillates between $104,492 and $105,376, reflecting a tightly confined trading band.
Bitcoin Technical Analysis: Will a Break Above $106K Ignite a Rally Back to $109K?
This article was published more than a month ago. Some information may no longer be current.
WRITTEN BY
SHARE

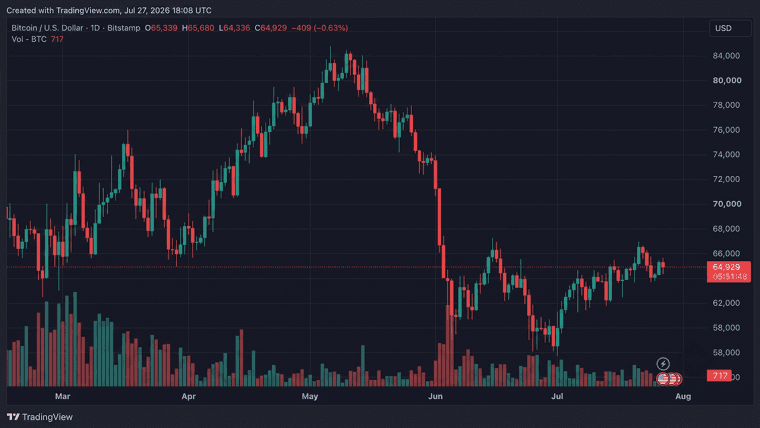
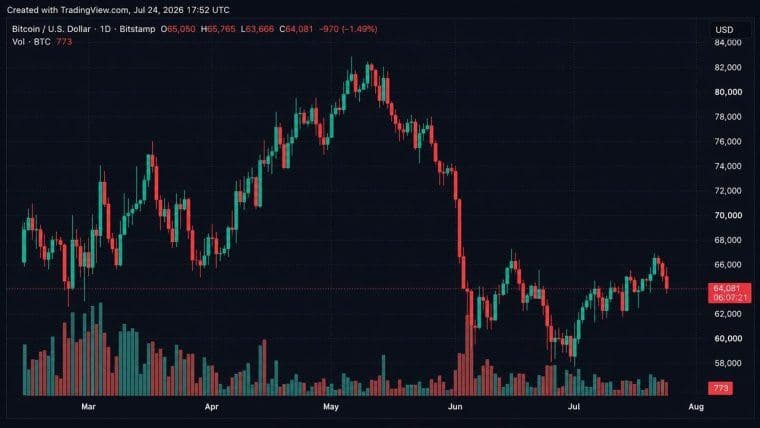
Bitcoin
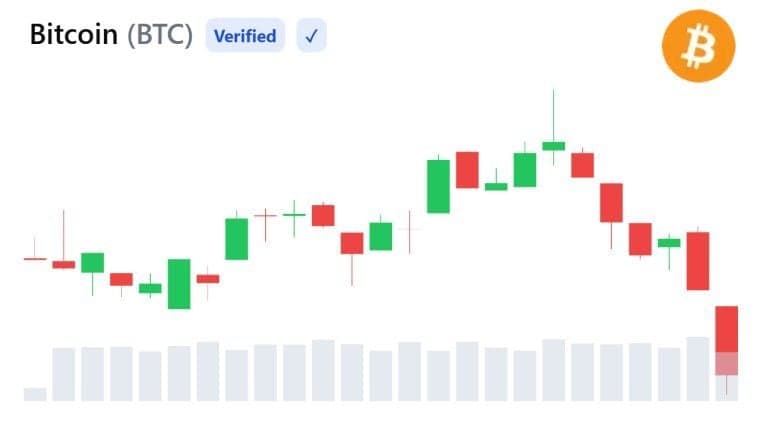
On the daily chart, bitcoin demonstrates a discernible recovery from its prior nadir of $89,164, establishing a sequence of progressively higher lows indicative of a strengthening directional bias. The price remains anchored within the $104,000–$106,000 corridor, while declining trade volumes subtly allude to waning momentum. Should the price breach the $106,000 threshold, it could catalyze an advance toward $109,000. Conversely, a descent below $102,000 may precipitate a retraction to the $98,000 support zone.

The 4-hour chart accentuates a protracted consolidation phase, punctuated by the recurrent emergence of indecision candlesticks, such as spinning tops and dojis, as bitcoin oscillates between $104,000 and $106,000. Episodic volume surges during price fluctuations suggest the potential for pronounced movements. A decisive close above $106,000 would imply continued bullish momentum, whereas a drop beneath $104,000 could pave the way for a test of $103,000.

Zooming into the 1-hour chart, bitcoin exhibits micro-level consolidation between $104,500 and $105,500, characterized by diminutive candlestick bodies reflective of tepid momentum. Intermittent volume spikes signal the persistence of short-term trading activity. Traders may consider entering long positions above $105,500, with targets at $106,500, or short positions below $104,000, targeting $103,500. Meticulous stop-loss strategies are imperative to mitigate the inherent volatility.

Oscillators paint a nuanced picture of market sentiment, leaning broadly neutral. The relative strength index (RSI) at 60, Stochastic at 77, commodity channel index (CCI) at 80, average directional index (ADX) at 13, and the awesome oscillator at 6,311 collectively reflect the absence of a definitive directional bias. However, both the momentum oscillator, registering at 4,866, and the moving average convergence divergence (MACD) at 2,208 indicate buy conditions, suggesting upward potential should momentum intensify.
Moving averages (MAs) furnish a predominantly bullish outlook. The exponential moving average (EMA) and simple moving average (SMA) across key periods—10, 20, 30, 50, 100, and 200—uniformly suggest upward pressure. The EMA (10) at $103,337 and SMA (10) at $104,006 establish short-term support levels, while longer-term trends remain firmly bolstered by the EMA (200) at $81,572 and SMA (200) at $76,469, affirming bitcoin’s entrenched upward trajectory over an extended timeframe.
Over the past 24 hours, derivatives exchanges recorded $8.47 million in liquidations, with $3.57 million in long positions and $4.91 million in short positions being closed. This reveals a pronounced state of indecision among market participants as bitcoin consolidates within its prevailing range, with traders awaiting a definitive directional breakout to recalibrate their strategies.
Bull Verdict:
Bitcoin’s technical indicators, particularly the alignment of moving averages and the buy signals from the momentum oscillator and MACD, suggest the potential for continued upward movement. A sustained break above $106,000 could invigorate bullish momentum, opening the door for a push toward $109,000 and potentially beyond. The formation of higher lows on the daily chart underscores the resilience of the broader uptrend.
Bear Verdict:
Despite the upward trajectory, tapering volume and the prevalence of indecision candlesticks signal weakening momentum, leaving bitcoin vulnerable to a pullback. A drop below $102,000 could trigger a deeper retracement toward the $98,000 support level. Additionally, continued consolidation and market indecision highlight the potential for bearish pressure if key support levels are breached.