Bitcoin (BTC) is holding firm at $90,466 to $90,738 over the last hour, taking a breather after its recent climb to the $93,483 all-time high. Traders are closely eyeing pivotal support and resistance levels as the market readies for its next big move.
Bitcoin Technical Analysis: Candlestick Patterns and Volume Trends Hint at Bitcoin’s Next Move
This article was published more than a month ago. Some information may no longer be current.
WRITTEN BY
SHARE

Bitcoin
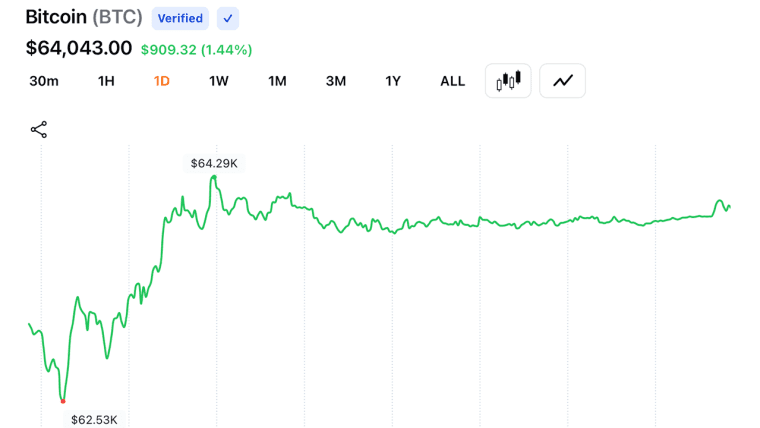
On the daily chart, bitcoin’s rally from $64,802 to $93,483 has shifted into a consolidation phase within the $90,000–$92,000 range. Candlestick patterns reflect uncertainty, with small bodies and long wicks on either side. Trading volume, which spiked during the breakout, has since tapered off, signaling a more cautious sentiment. Breaking above $93,500 could reignite the bullish trend, while falling below $88,000 may suggest a deeper correction ahead.

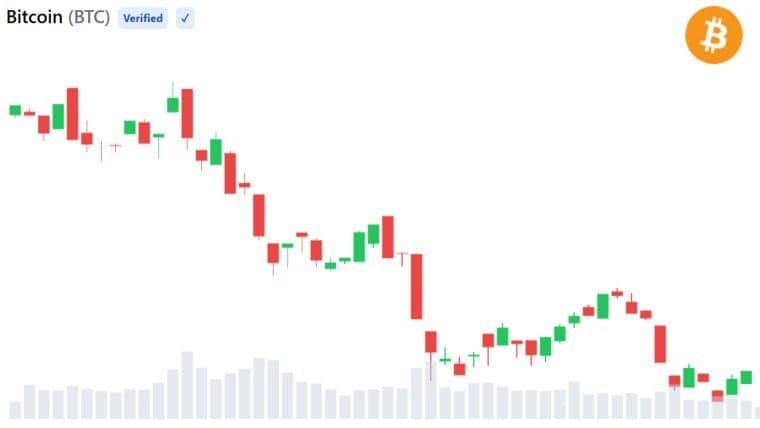
The four-hour chart shows bitcoin bouncing between $90,000 and $93,500. A pattern of lower highs indicates short-term bearish momentum, but support at $90,000 has remained steadfast. Profit-taking during pullbacks and renewed buying interest highlight active market participation. Traders could consider long positions near $90,000 with tight stop-losses, while resistance at $93,500 acts as a critical threshold for upward movement.

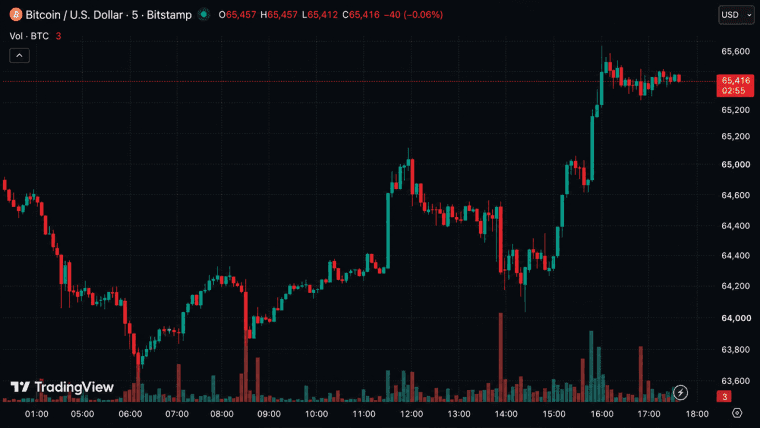
On the 1-hour chart, bitcoin repeatedly tests the $90,000 support level, rebounding from $88,709 to peak around $92,234 before pulling back. Declining volume during retracements suggests limited selling pressure, though caution remains as the price edges toward key levels. Scalpers and short-term traders may aim for gains in the $90,000–$92,500 range, placing stop-losses below $89,000 to manage downside risks.

Technical indicators provide mixed signals, emphasizing the market’s indecisiveness. Oscillators like the relative strength index (RSI) and stochastic oscillator (SO) are neutral at 74 and 88, respectively. Meanwhile, the moving average convergence divergence (MACD) shows a buy signal at 6,147. The commodity channel index (CCI) at 95 points to consolidation, adds to the complex picture. Moving averages remain bullish across timeframes, with short-term averages above $86,000 and long-term averages near $64,652 offering solid support.
Bull Verdict:
If bitcoin breaks above $93,500 with sustained momentum, the bullish trend is likely to continue, potentially targeting $95,000 or higher. Traders with long positions should monitor these resistance levels for opportunities to capitalize on upside potential.
Bear Verdict:
If bitcoin falls below the $90,000 support and breaches $88,000, a deeper correction could unfold, with targets in the mid-$80,000s. Traders should exercise caution and consider tighter risk controls to navigate this potential downturn.