Bitcoin’s price on December 1, 2024, hovers around $97,124, reflecting a consolidation phase as the cryptocurrency market evaluates its next directional move.
Bitcoin Technical Analysis: BTC’s Price Trends Show Consolidation at Key Levels
This article was published more than a month ago. Some information may no longer be current.
WRITTEN BY
SHARE

Bitcoin
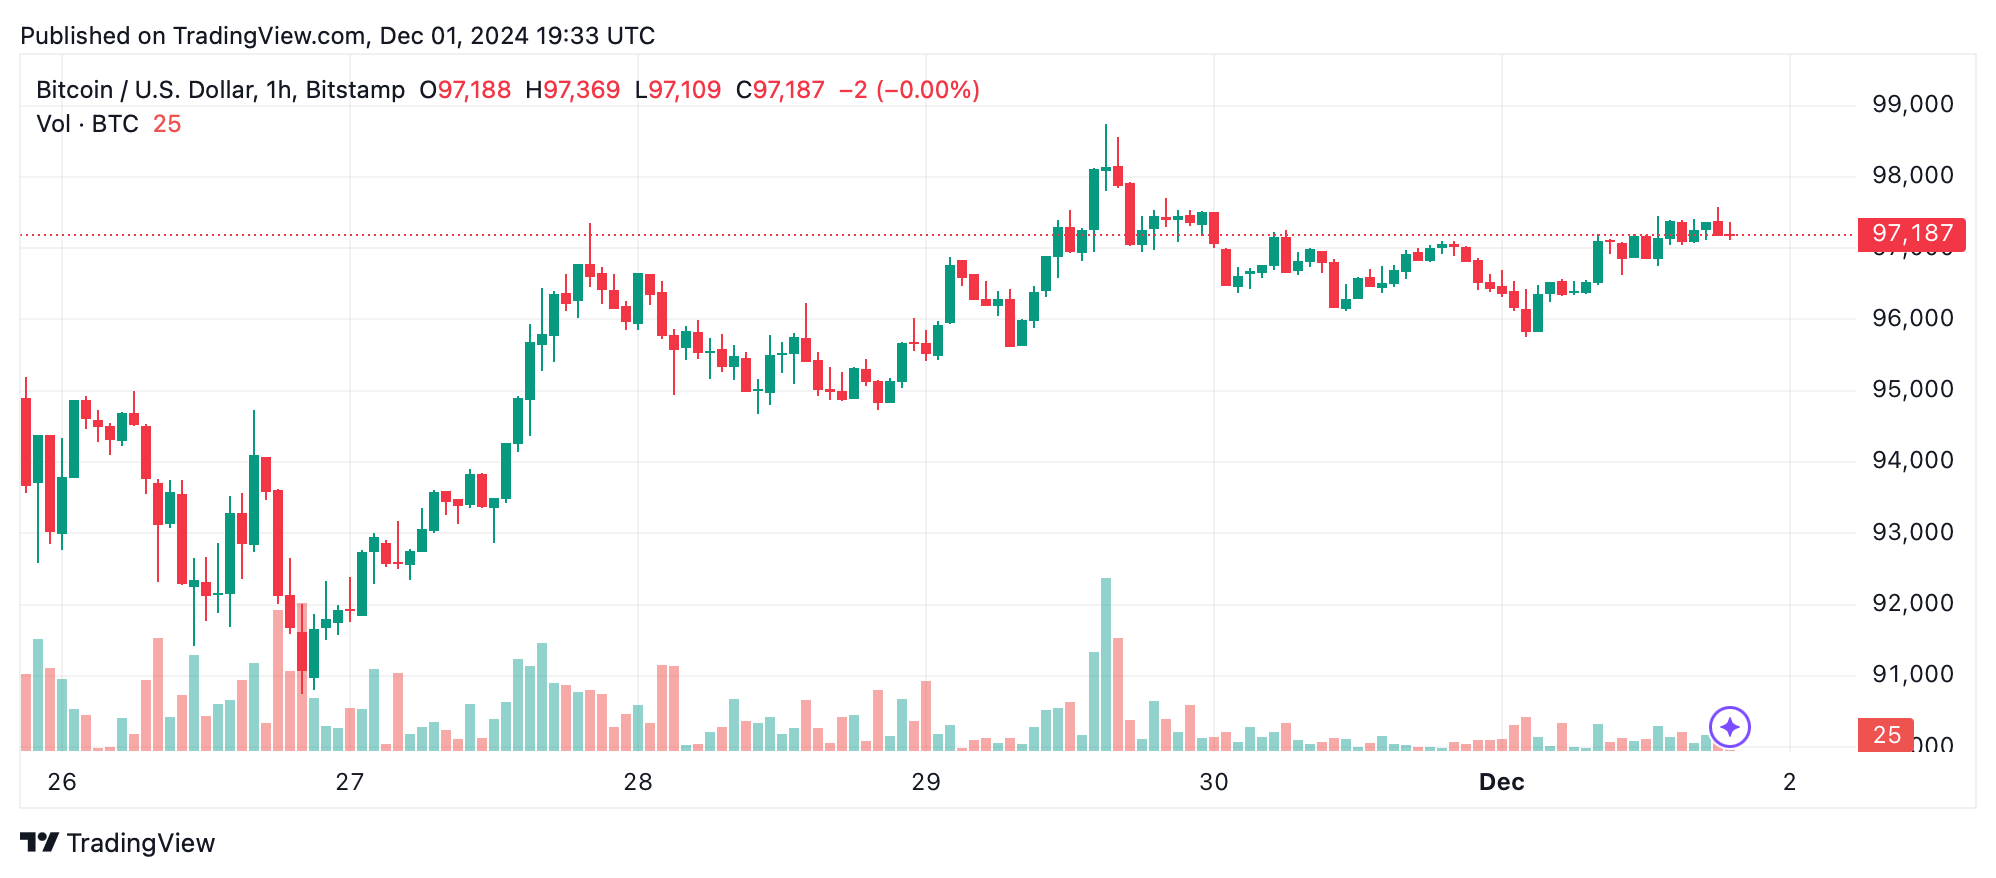
The 1-hour chart reveals bitcoin ( BTC) recently rebounded after touching a low of $95,758. It is now trading within a narrow range of $97,000 to $97,500. Current chart patterns show indecision, and tapering volume during this consolidation phase indicates traders are awaiting a breakout. A move above $97,500, confirmed by strong volume, could signal bullish momentum, while failure to sustain $96,500 may trigger a downside.
Key technical indicators support this mixed outlook. The relative strength index ( RSI) reads neutral at 67, aligning with the neutral signals from the Stochastic oscillator, commodity channel index (CCI), and awesome oscillator. Momentum at -1,188 and the moving average convergence divergence ( MACD) at 5,018 suggest bearish undertones in the short term.
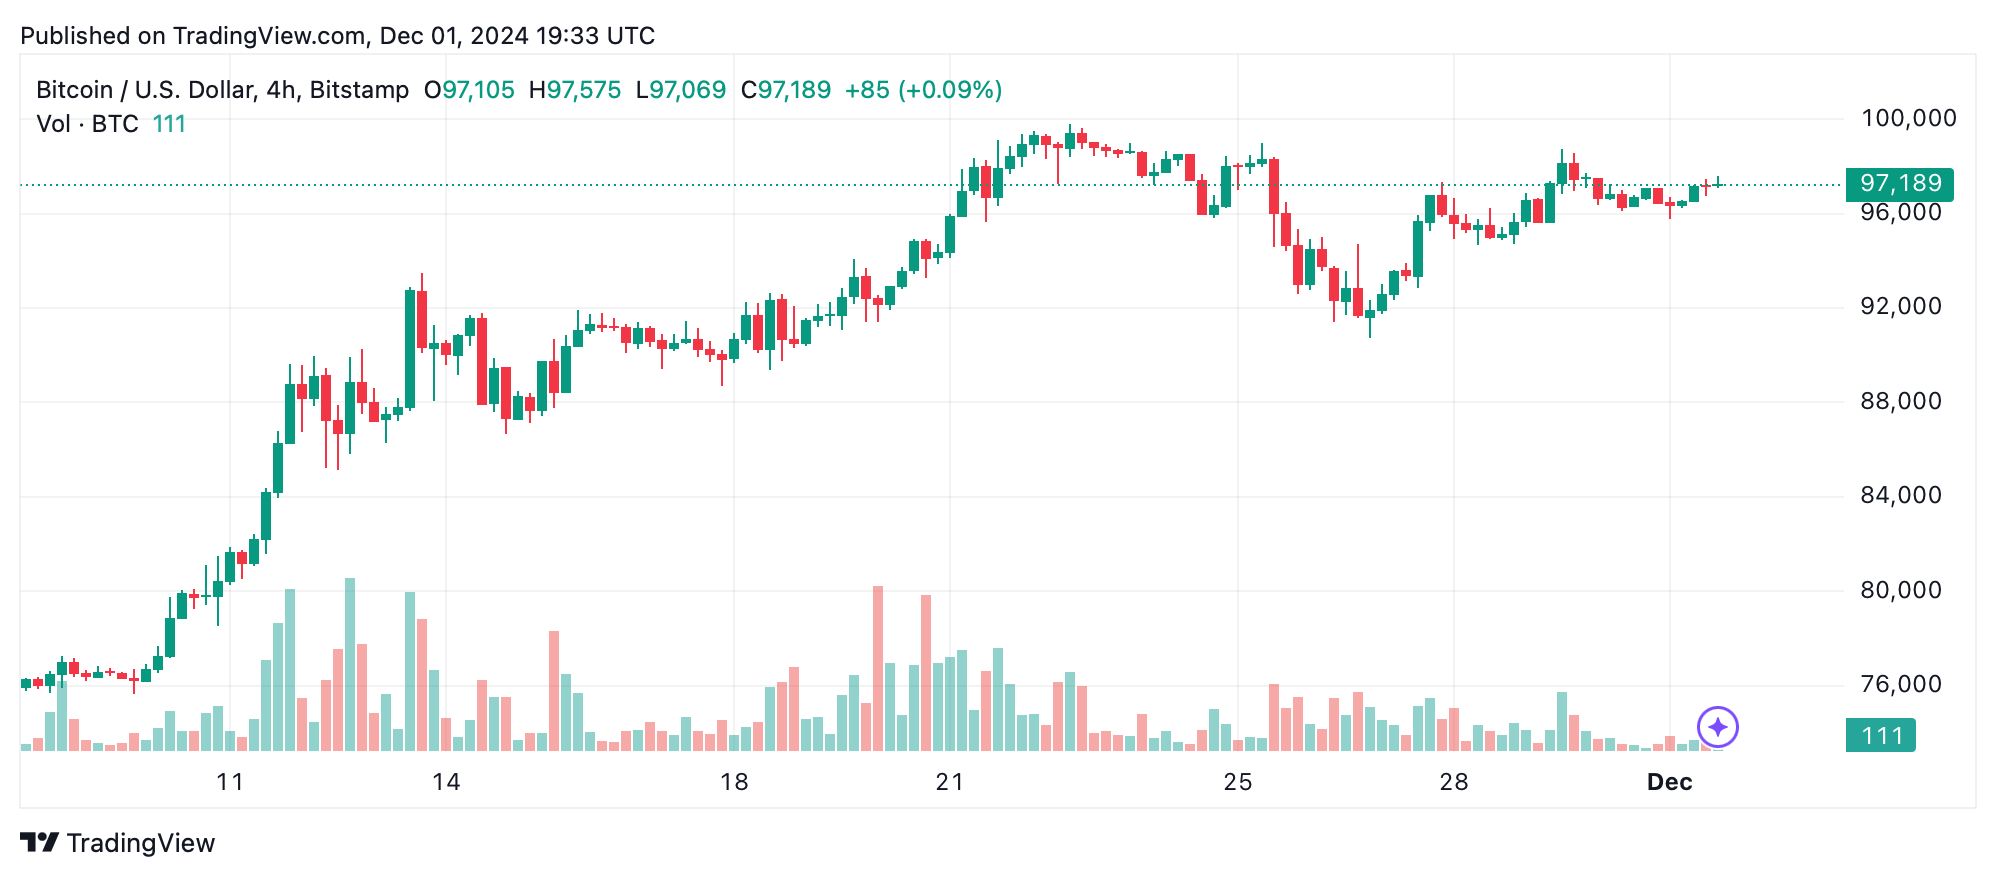
On the same token, the 4-hour chart, bitcoin has been forming higher highs and lows, signaling an uptrend. However, the slowing momentum near $98,745, coupled with declining trading volumes, indicates exhaustion. The mid-term chart suggests a potential breakout from tight price action.
Critical levels to watch include support at $95,000 to $95,500 and resistance at $98,745. A breakout above $98,745 could signal continuation toward $100,000, while a breach below $95,000 may test lower levels around $93,000. Moving averages such as the exponential moving average (EMA-20) and simple moving average (SMA-20) indicate bullish trends, reinforcing the potential for upward movement.
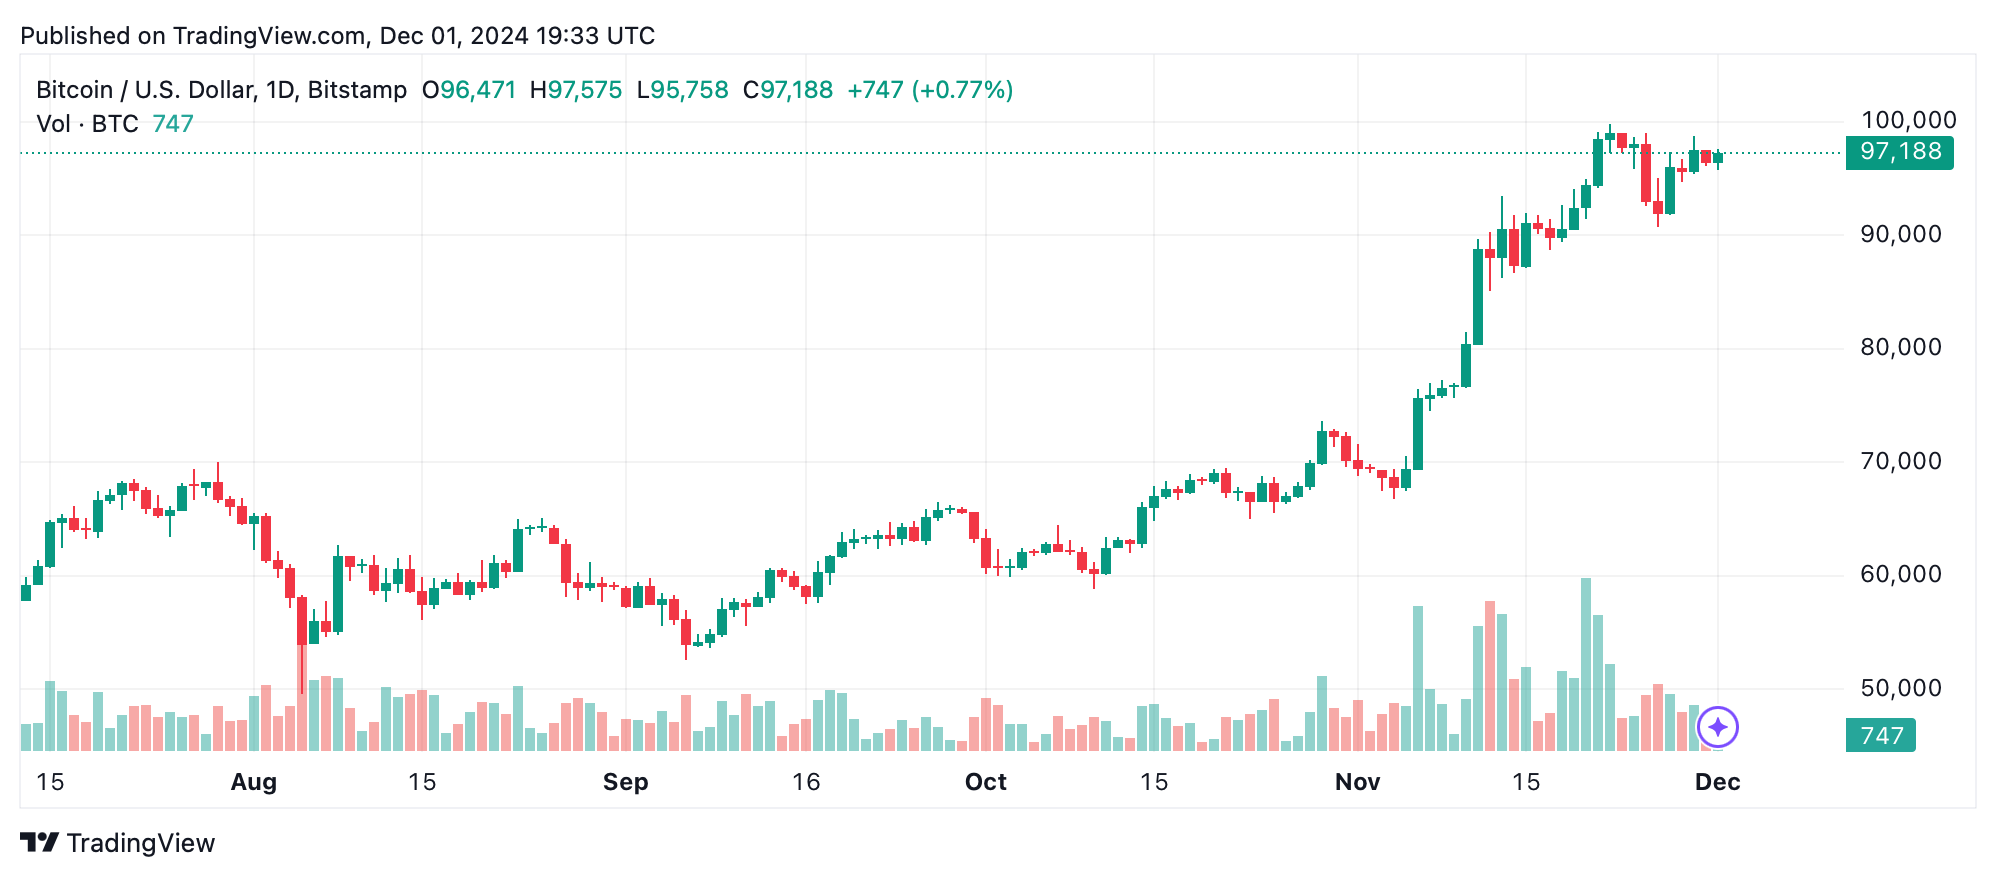
The daily chart outlines a strong uptrend since bitcoin hit $66,798 in early November, reaching a lifetime high of $99,800 before facing resistance near the psychological $100,000 mark. Smaller candlestick bodies on this chart around the $97,000 to $98,000 zone reveal hesitation among market participants.
Major support is located at $95,000, while a decisive breakout above $99,800 could propel prices to $102,000 or higher. Conversely, a daily close below $95,000 may invalidate the bullish pattern. Volume spikes during the rally suggest strong buying interest is still evident, but declining activity indicates a need for renewed momentum.
The moving averages (MAs) remain a cornerstone of bitcoin’s technical profile, consistently pointing to bullish sentiment. The EMA (10) at $95,543 and SMA (10) at $96,260 support short-term buying, while the EMA (100) at $75,158 and SMA (100) at $70,255 highlight strength in the broader trend. Notably, all monitored exponential and simple moving averages, ranging from 10 to 200 periods, suggest bullish conditions.
Bull Verdict:
Bitcoin’s technical setup leans bullish as it consolidates near critical resistance levels, supported by upward momentum on the 4-hour and daily charts. Moving averages across all timeframes underscore strong buying conditions, suggesting a breakout above $99,800 could push prices toward $102,000 or higher. Traders should monitor volume spikes to confirm a renewed rally.
Bear Verdict:
Despite the broader uptrend, bitcoin shows signs of exhaustion with declining momentum and volume across multiple timeframes. Bearish signals from the momentum and MACD, coupled with key support at $95,000 under threat, indicate a potential pullback toward $93,000 or lower if bulls fail to regain control.