Bitcoin traded at $112,996 to $113,210 over the last hour on Aug. 28, 2025, with a market capitalization of $2.24 trillion. Over the past 24 hours, it saw $37.65 billion in trading volume, fluctuating within a tight intraday range between $110,985 and $113,329.
Bitcoin Price Watch: Traders Brace for Volatility After Tight Price Coil
This article was published more than a month ago. Some information may no longer be current.
WRITTEN BY
SHARE

Bitcoin
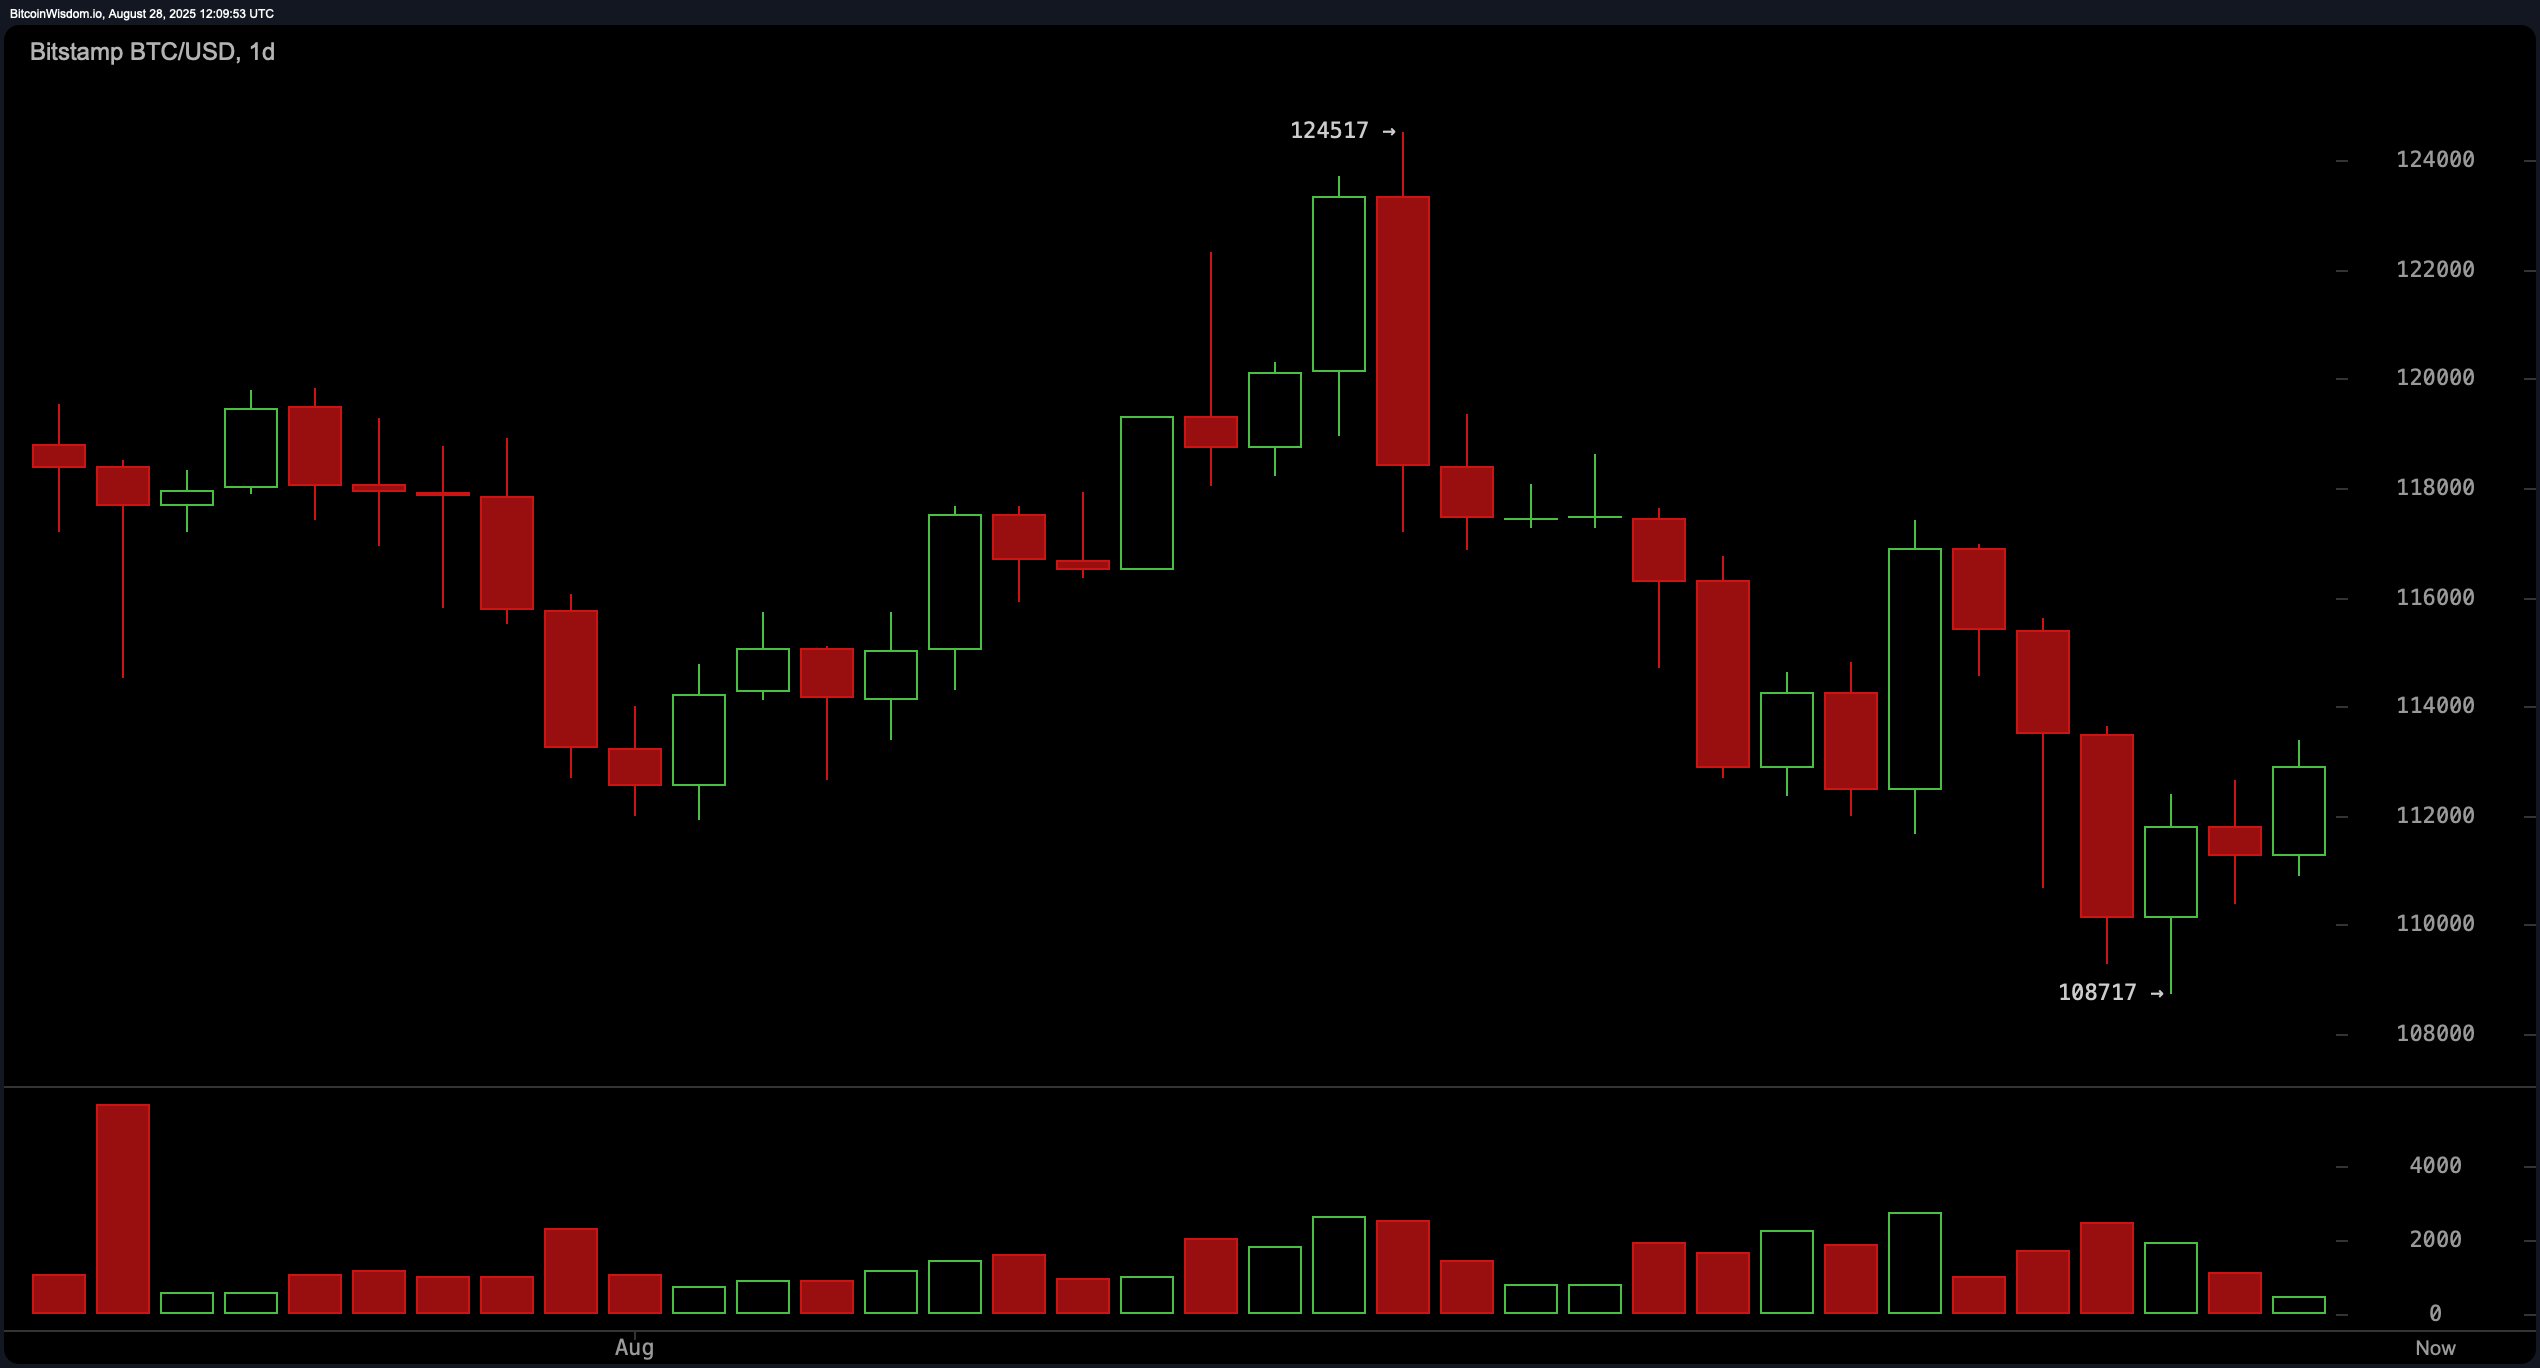
Bitcoin’s daily chart reveals a market in short-term consolidation following a downward break from a descending triangle pattern. Price structure indicates a lower high at $124,517 and a lower low at $108,717, placing current price levels near $113,000. A potential rebound is forming with volume increasing at recent lows, suggesting possible accumulation. Immediate support lies at $108,500, while resistance is seen at $117,500 and $124,500. A break above the $117,500 mark on strong volume could serve as a confirmation for bullish continuation, whereas a breach below $108,000 would likely negate this setup.
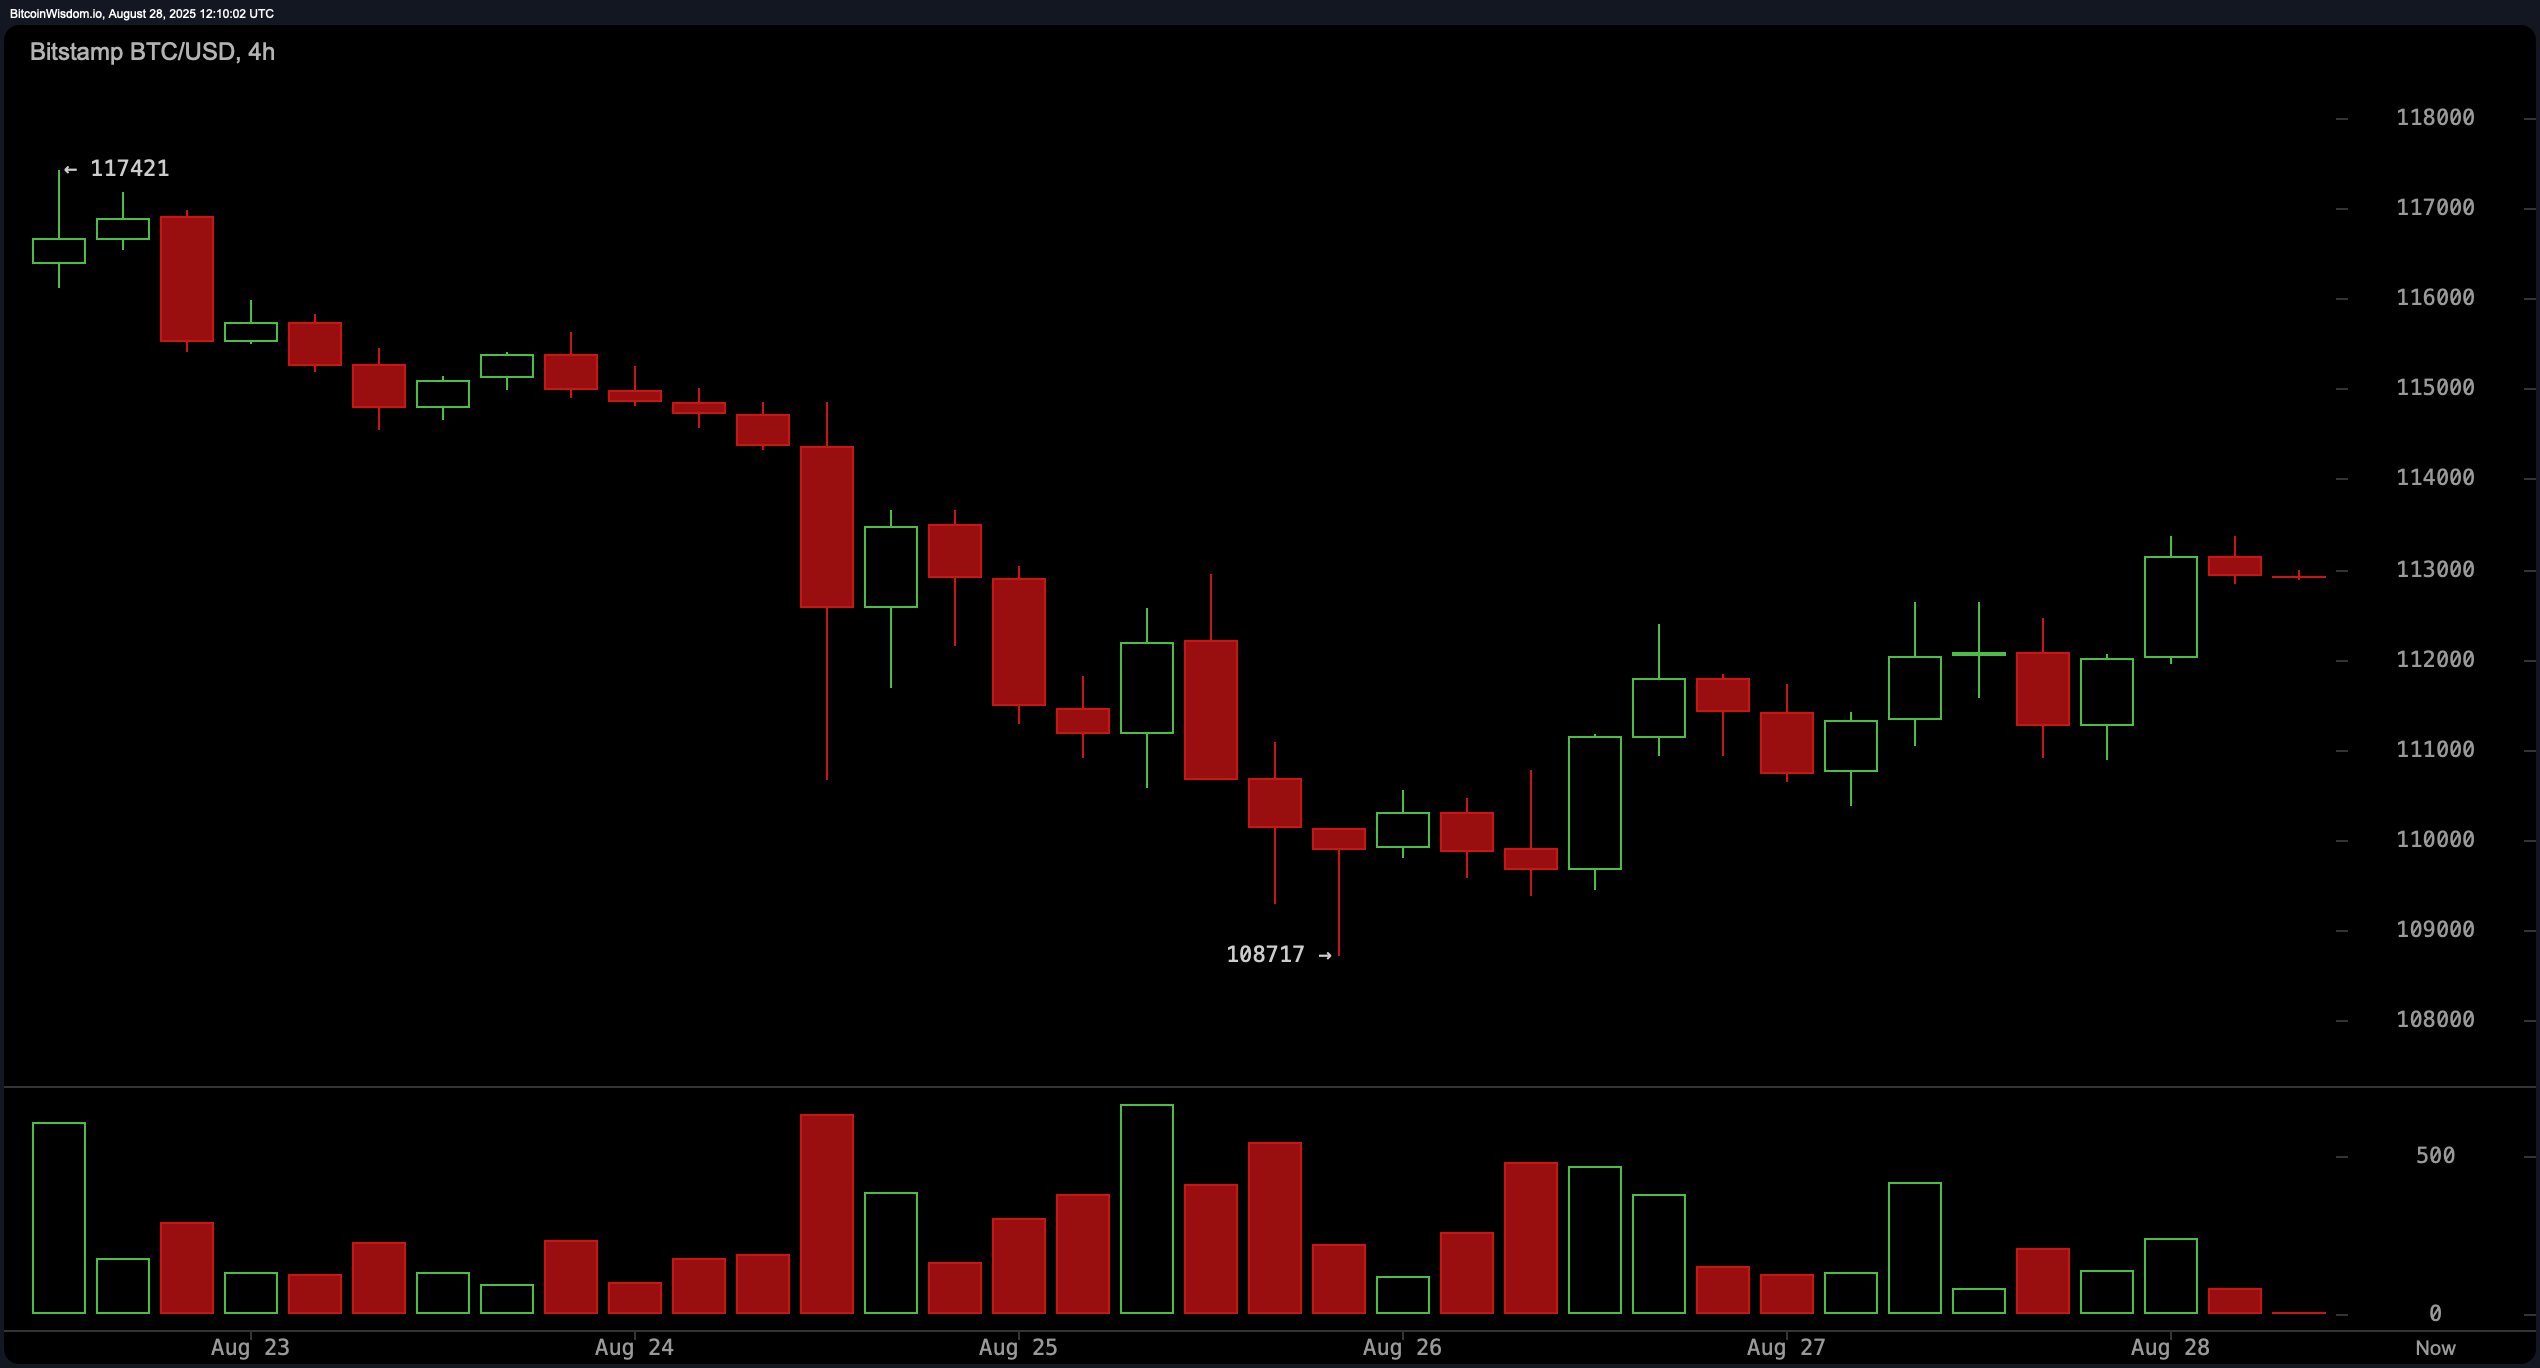
The 4-hour bitcoin chart illustrates a notable shift in trend from bearish to bullish, characterized by a higher high and higher low following a drop to $108,700. Momentum indicators show a subtle reversal pattern, supported by increased green volume bars. Bitcoin is currently trading near the $113,000–$113,500 range, a key resistance zone. A sustained breakout above this range with volume confirmation would reinforce upward momentum. Conversely, a failed attempt here combined with increased selling pressure could push prices back toward the $110,000 level, warranting cautious trade management.
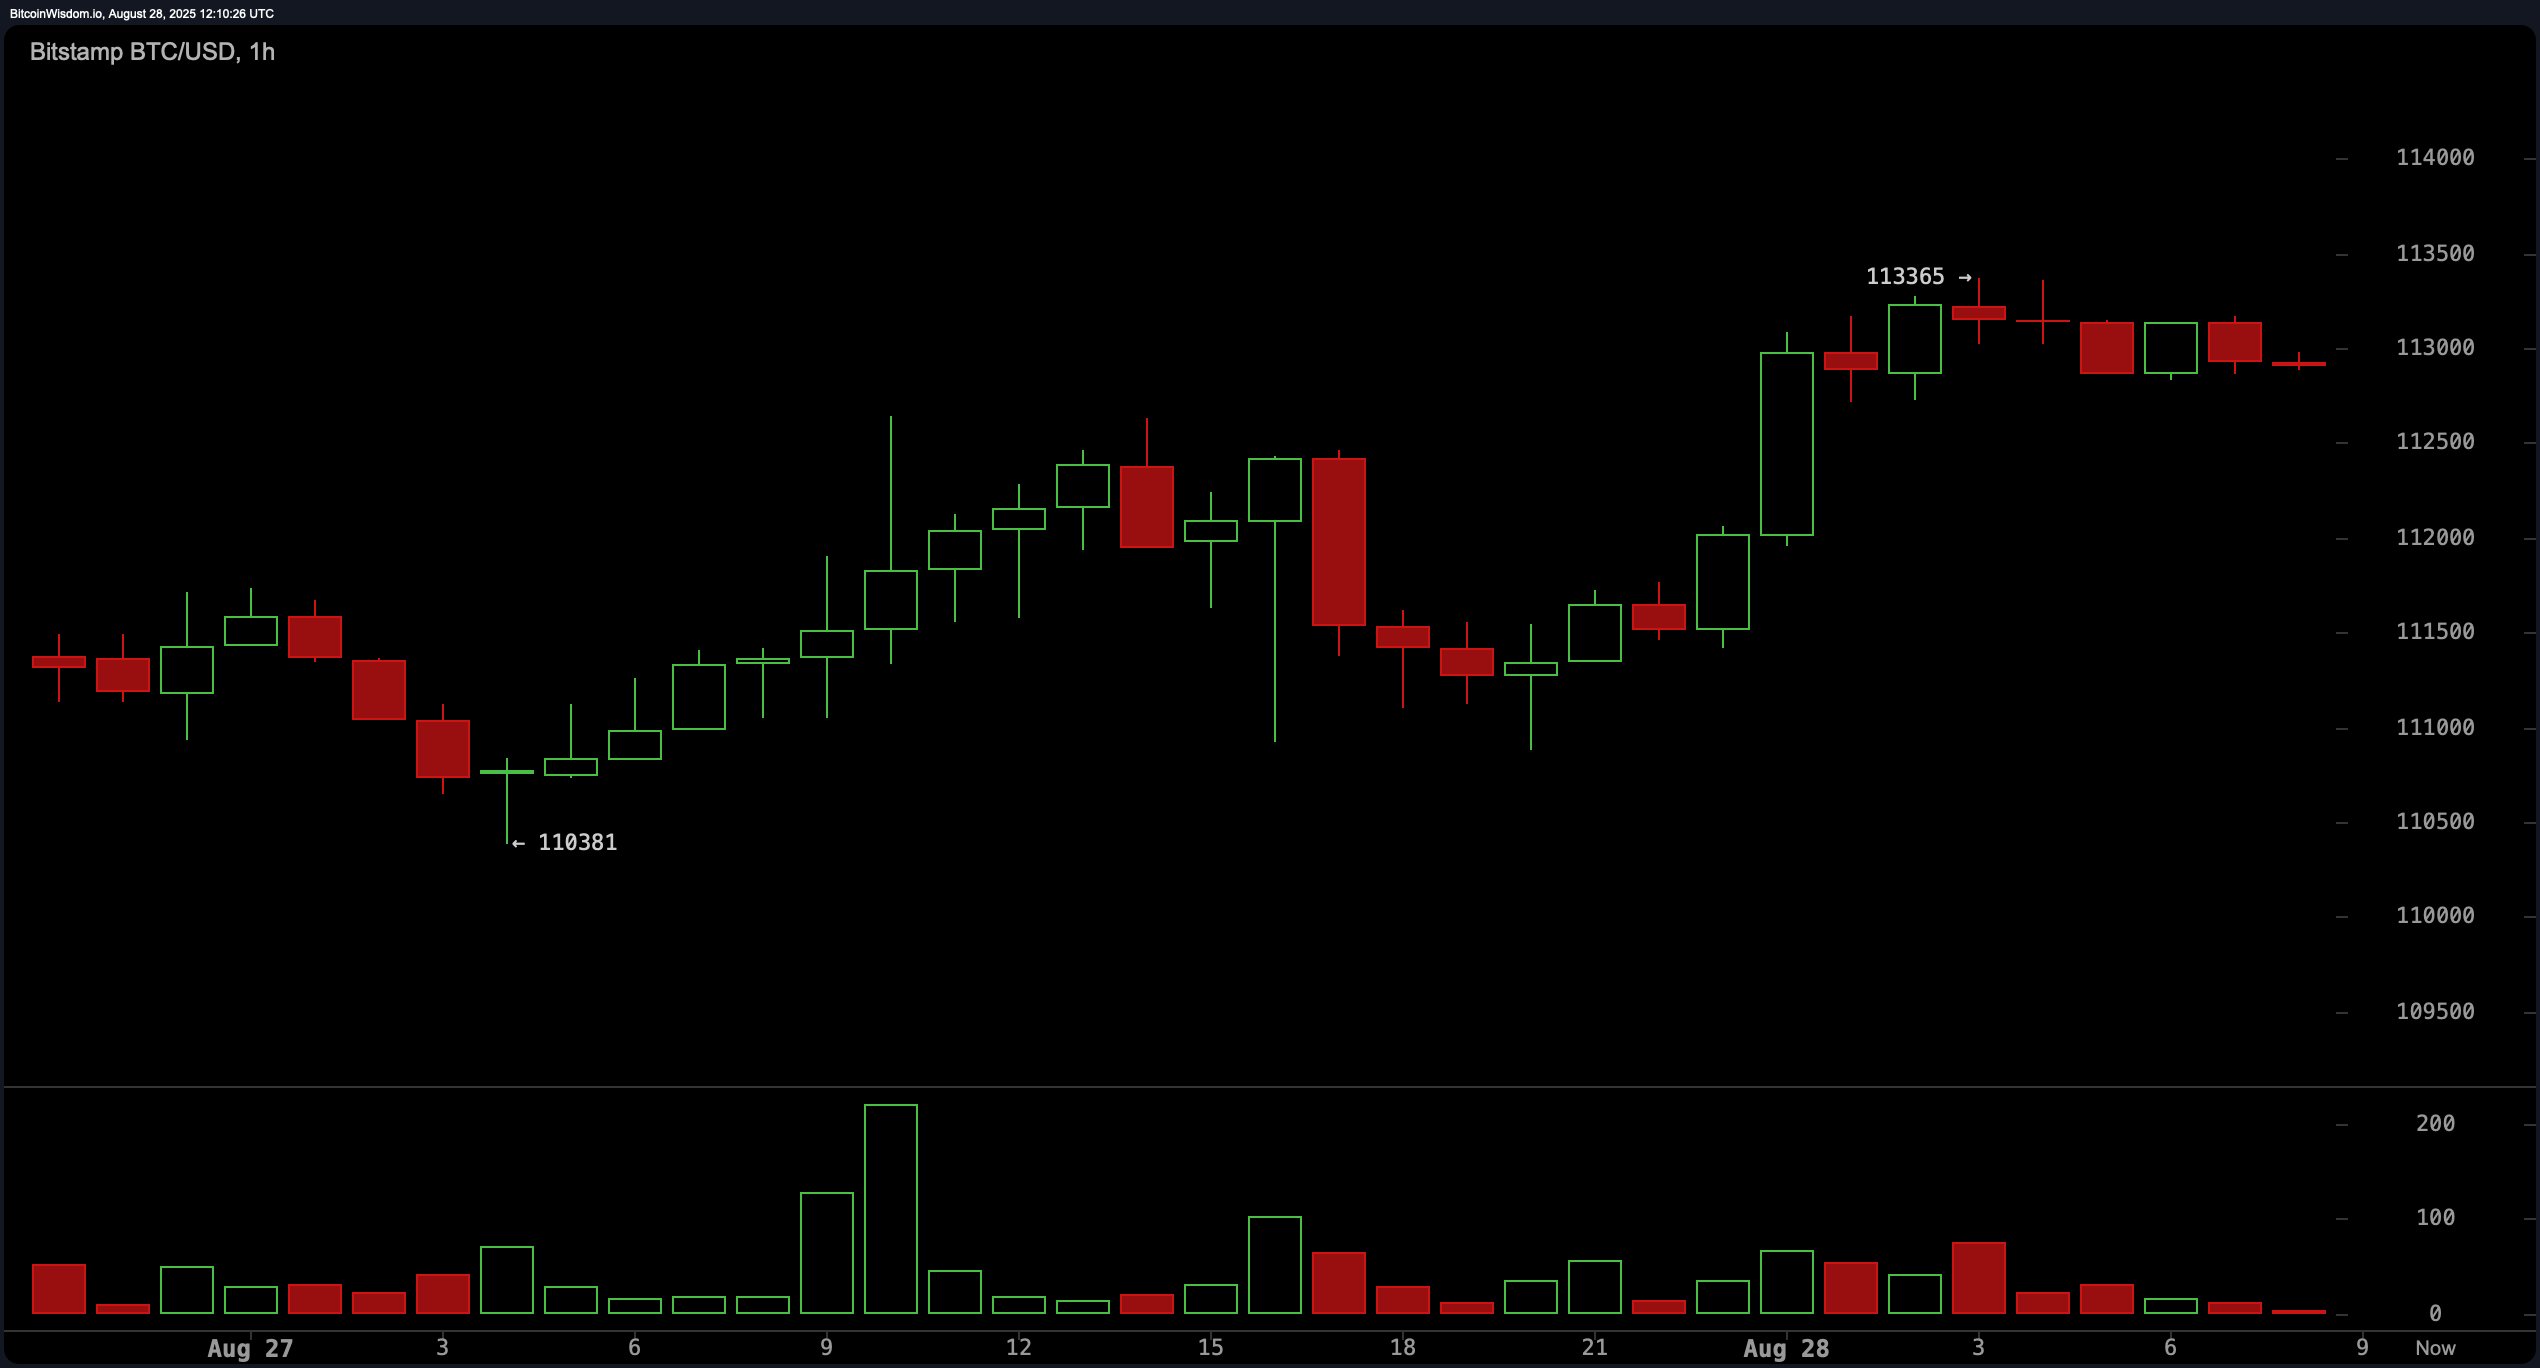
On the 1-hour chart, bitcoin is in a clear intraday uptrend, progressing from a base near $110,381 up to a recent high of $113,365. The price action is coiling within a flag-like pattern, typically indicative of a pending breakout or breakdown. Declining volume alongside this consolidation suggests trader indecision, awaiting a catalyst. An upside move above $113,500 could invite quick long entries targeting the $114,000–$114,500 region. However, if price slips below $111,500, stop-loss triggers should be considered for intraday trades.
Oscillator readings across multiple indicators are largely neutral. The relative strength index ( RSI) stands at 46, Stochastic oscillator at 25, and the commodity channel index (CCI) at -84, all suggesting indecision without extreme overbought or oversold signals. The average directional index (ADX) at 17 implies a weak trend. Notably, the momentum oscillator highlights a bullish signal at -3,349, while the moving average convergence divergence ( MACD) level at -1,183 suggests a bearish trend. This divergence reflects the broader uncertainty within the market’s current phase.
Moving averages (MAs) portray a split landscape across timeframes. Shorter-term averages, including the exponential moving average (EMA) and simple moving average (SMA) for 10, 20, and 30 periods, all reflect bearish conditions with sell signals. However, longer-term EMAs and SMAs at the 100 and 200 intervals are bullish, indicating underlying strength. The EMA (100) at $110,905 and SMA (100) at $111,726 suggest the price is well supported at lower levels, while the EMA (200) at $103,939 and SMA (200) at $101,094 underline the broader bullish trend that remains intact despite recent volatility.
Bull Verdict:
If bitcoin decisively breaks above the $113,500 resistance level on strong volume and sustains this move, bullish momentum may accelerate toward the $117,500 and $124,500 resistance zones. The presence of higher lows, a recovering 4-hour trend, and longer-term moving average support all bolster the case for continued upward movement in the short to medium term.
Bear Verdict:
Should bitcoin fail to overcome the $113,500 resistance and instead drop below the $111,500–$110,000 support band, bearish pressure could resume. The presence of multiple short-term moving average sell signals and the lack of strong oscillator conviction warn that a downside continuation toward the $108,000 level remains a credible risk.