Bitcoin was priced at $95,426 on May 4, 2025, with a market capitalization of $1.895 trillion. Over the past 24 hours, it recorded a trade volume of $13.546 billion and fluctuated within a narrow intraday range of $95,415 to $96,493.
Bitcoin Price Watch: Support Holds Near $95K Amid Volume Drop
This article was published more than a month ago. Some information may no longer be current.
WRITTEN BY
SHARE

Bitcoin
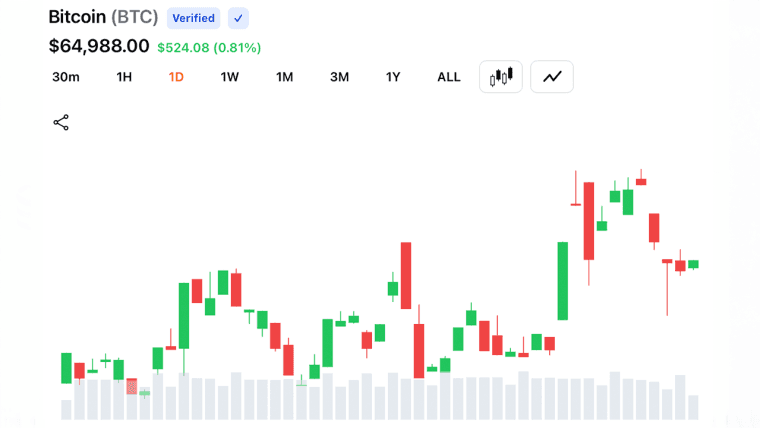
The daily chart highlights a broader uptrend continuation following a significant rally from the recent low of $74,434. However, signs of local exhaustion are emerging. Three consecutive red candles near the resistance of $97,938 suggest short-term hesitation, especially as trading volume has declined—indicating waning bullish momentum. This divergence between rising prices and falling volume typically signals a possible retracement or consolidation. The strategy here leans bullish, recommending a buy-the-dip approach in the $92,000 to $94,000 zone, while eyeing profit near the $97,000 to $98,000 range unless a high- volume breakout occurs.

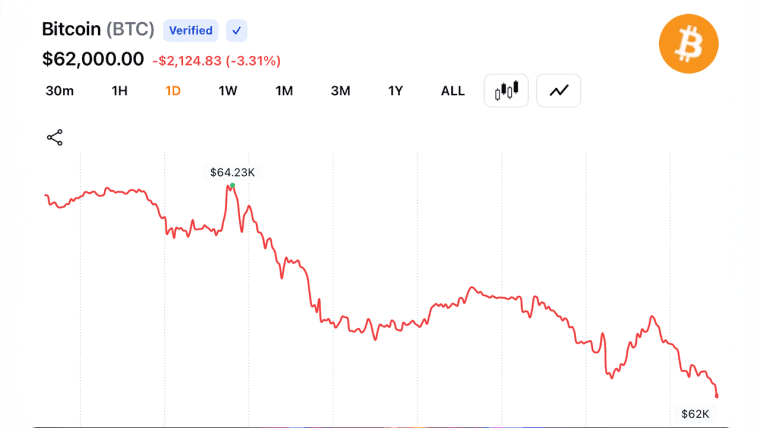
The 4-hour chart depicts a clear short-term downtrend setting in after the failed push above $97,000. The market structure has shifted to lower highs and lower lows, with $92,846 emerging as a key support level. Bearish volume currently dominates, reinforcing downward pressure. For short-term traders, an aggressive short entry near $96,000 to $96,500 could be considered, placing stop-loss orders above $97,500. A more conservative long position could be justified if a bullish pattern or divergence forms near the $92,800 to $93,000 zone, offering a lower-risk entry amid declining momentum.

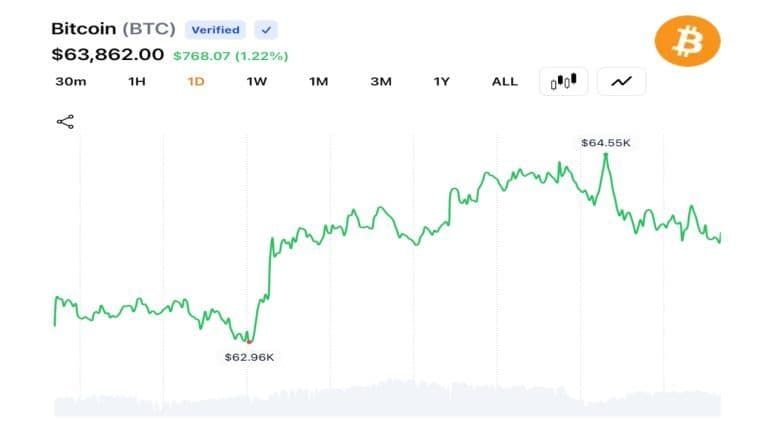
On the 1-hour chart, bitcoin maintains a firm downward trajectory with no meaningful signs of reversal. The most recent support rests at $95,330, while resistance continues to loom at $97,938. The prevailing downtrend is reinforced by low- volume bullish attempts, characterized by weak, small-bodied green candles. Scalp traders may find short opportunities if the price fails again at the $96,000 to $96,300 level. Conversely, a bullish engulfing candle with strong volume near $95,000 to $95,300 may warrant a quick long scalp, targeting $96,000 but with tight stop-loss protection.

Momentum indicators present a mixed outlook. The relative strength index ( RSI) at 65, Stochastic at 86, commodity channel index (CCI) at 68, average directional index (ADX) at 32, and Awesome oscillator all read neutral. Meanwhile, momentum (10) signals a sell, contrasting with a buy signal from the moving average convergence divergence ( MACD) level at 3,036. This incongruity reflects a market in consolidation, awaiting a decisive move. Until a breakout is confirmed, traders should monitor volume closely and proceed cautiously.
Moving averages collectively underscore a bullish bias. All short-, medium-, and long-term readings—across both exponential moving averages (EMA) and simple moving averages (SMA)—support upward momentum. The 10-period EMA and SMA are above the current price, signaling strong immediate support, while the 200-period indicators suggest longer-term bullish structure remains intact. This layered alignment of buy signals reinforces the uptrend on a macro level, though short-term volatility and resistance zones demand careful timing for new entries.
Bull Verdict:
If bitcoin sustains its position above $94,000 and volume reaccelerates, the broader uptrend remains intact with potential to retest and break the $97,938 resistance. Consistently strong buy signals from exponential and simple moving averages, combined with the buy indication from the moving average convergence divergence ( MACD), support a bullish continuation scenario—particularly if price action stabilizes on the lower timeframes.
Bear Verdict:
A break below the $91,500 level on significant volume would invalidate the current bullish structure and confirm a near-term reversal. Weak intraday momentum, selling pressure on shorter timeframes, and a bearish signal from the momentum oscillator point to vulnerability. In this case, bitcoin could retrace further, testing support zones near $88,000 or below before any meaningful recovery attempt.