Bitcoin traded at $117,509 on Aug. 16, 2025, with a market capitalization of $2.33 trillion. The 24-hour trading volume reached $39.69 billion, with the intraday price fluctuating between $116,956 and $119,152.
Bitcoin Price Watch: Rejection From $124K Sparks Short-Term Bearish Outlook
WRITTEN BY
SHARE

Bitcoin
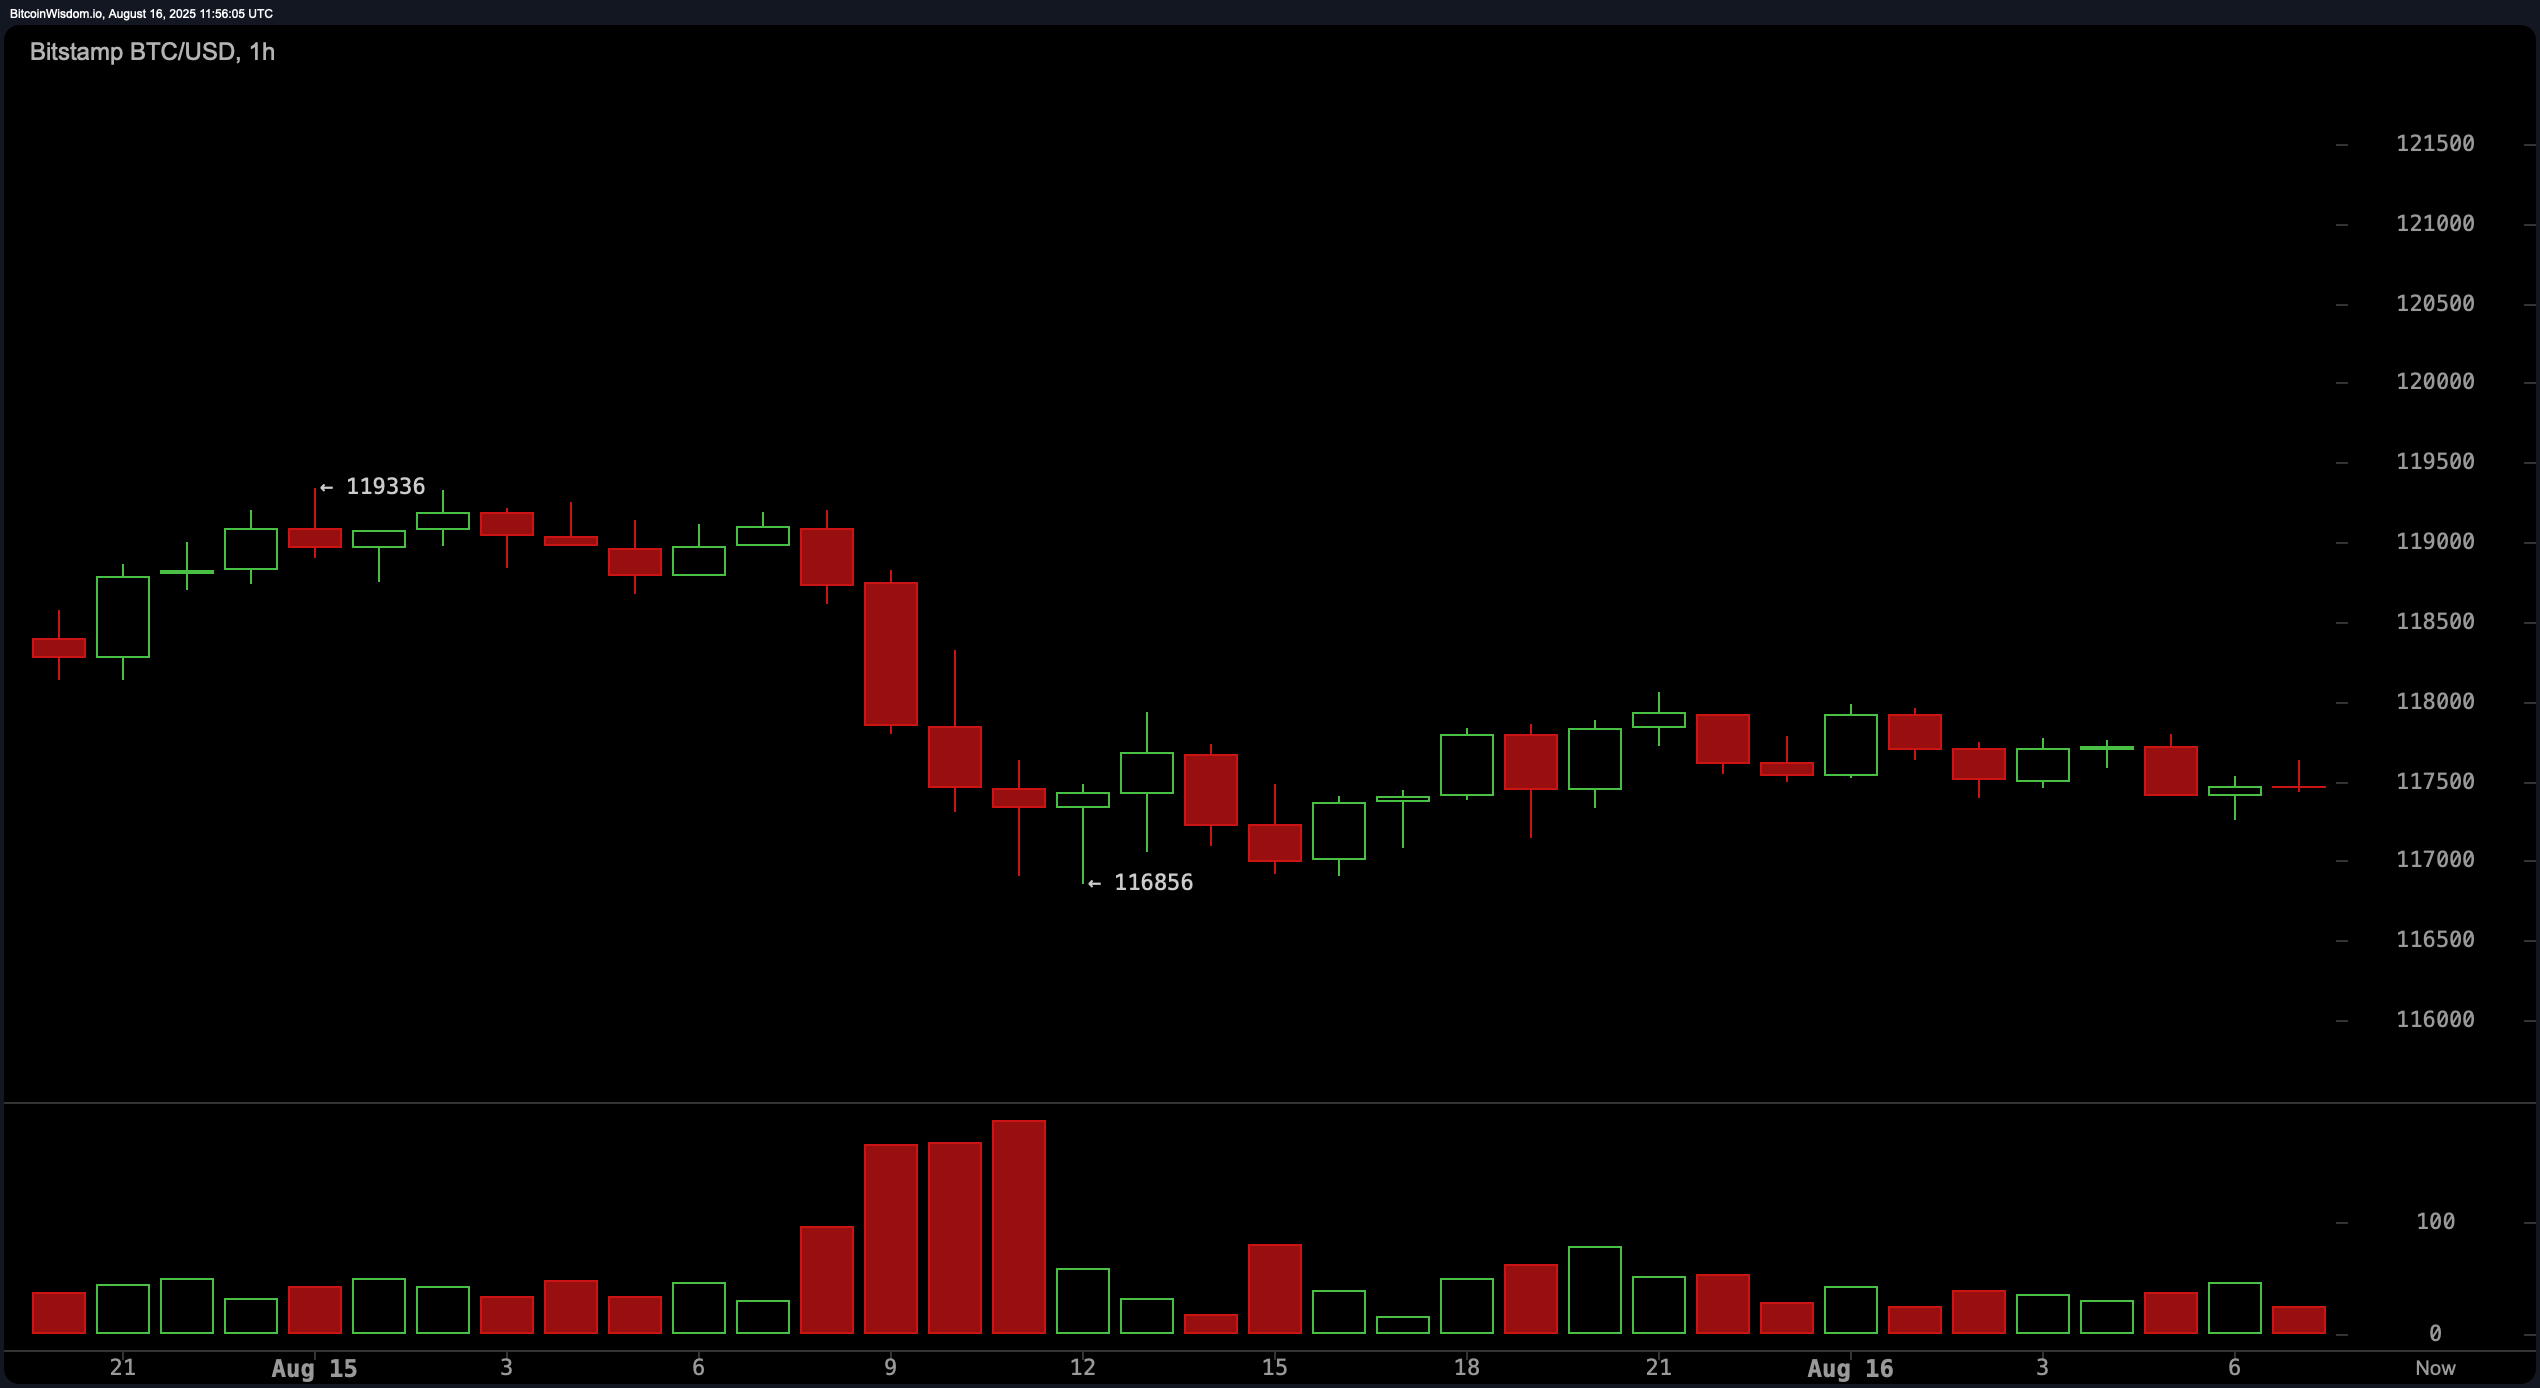
On the 1-hour chart, bitcoin displayed a weakening market structure, characterized by a sequence of lower highs and lower lows, following a local peak at $119,336. While a minor bounce occurred at $116,856, the lack of volume confirmed a weak bullish presence, reinforcing a bearish outlook. A break below $117,000 suggested an actionable short setup, targeting the $116,000 range. Conversely, reclaiming the $118,500 to $119,000 zone with convincing volume might invalidate the downtrend in this timeframe.
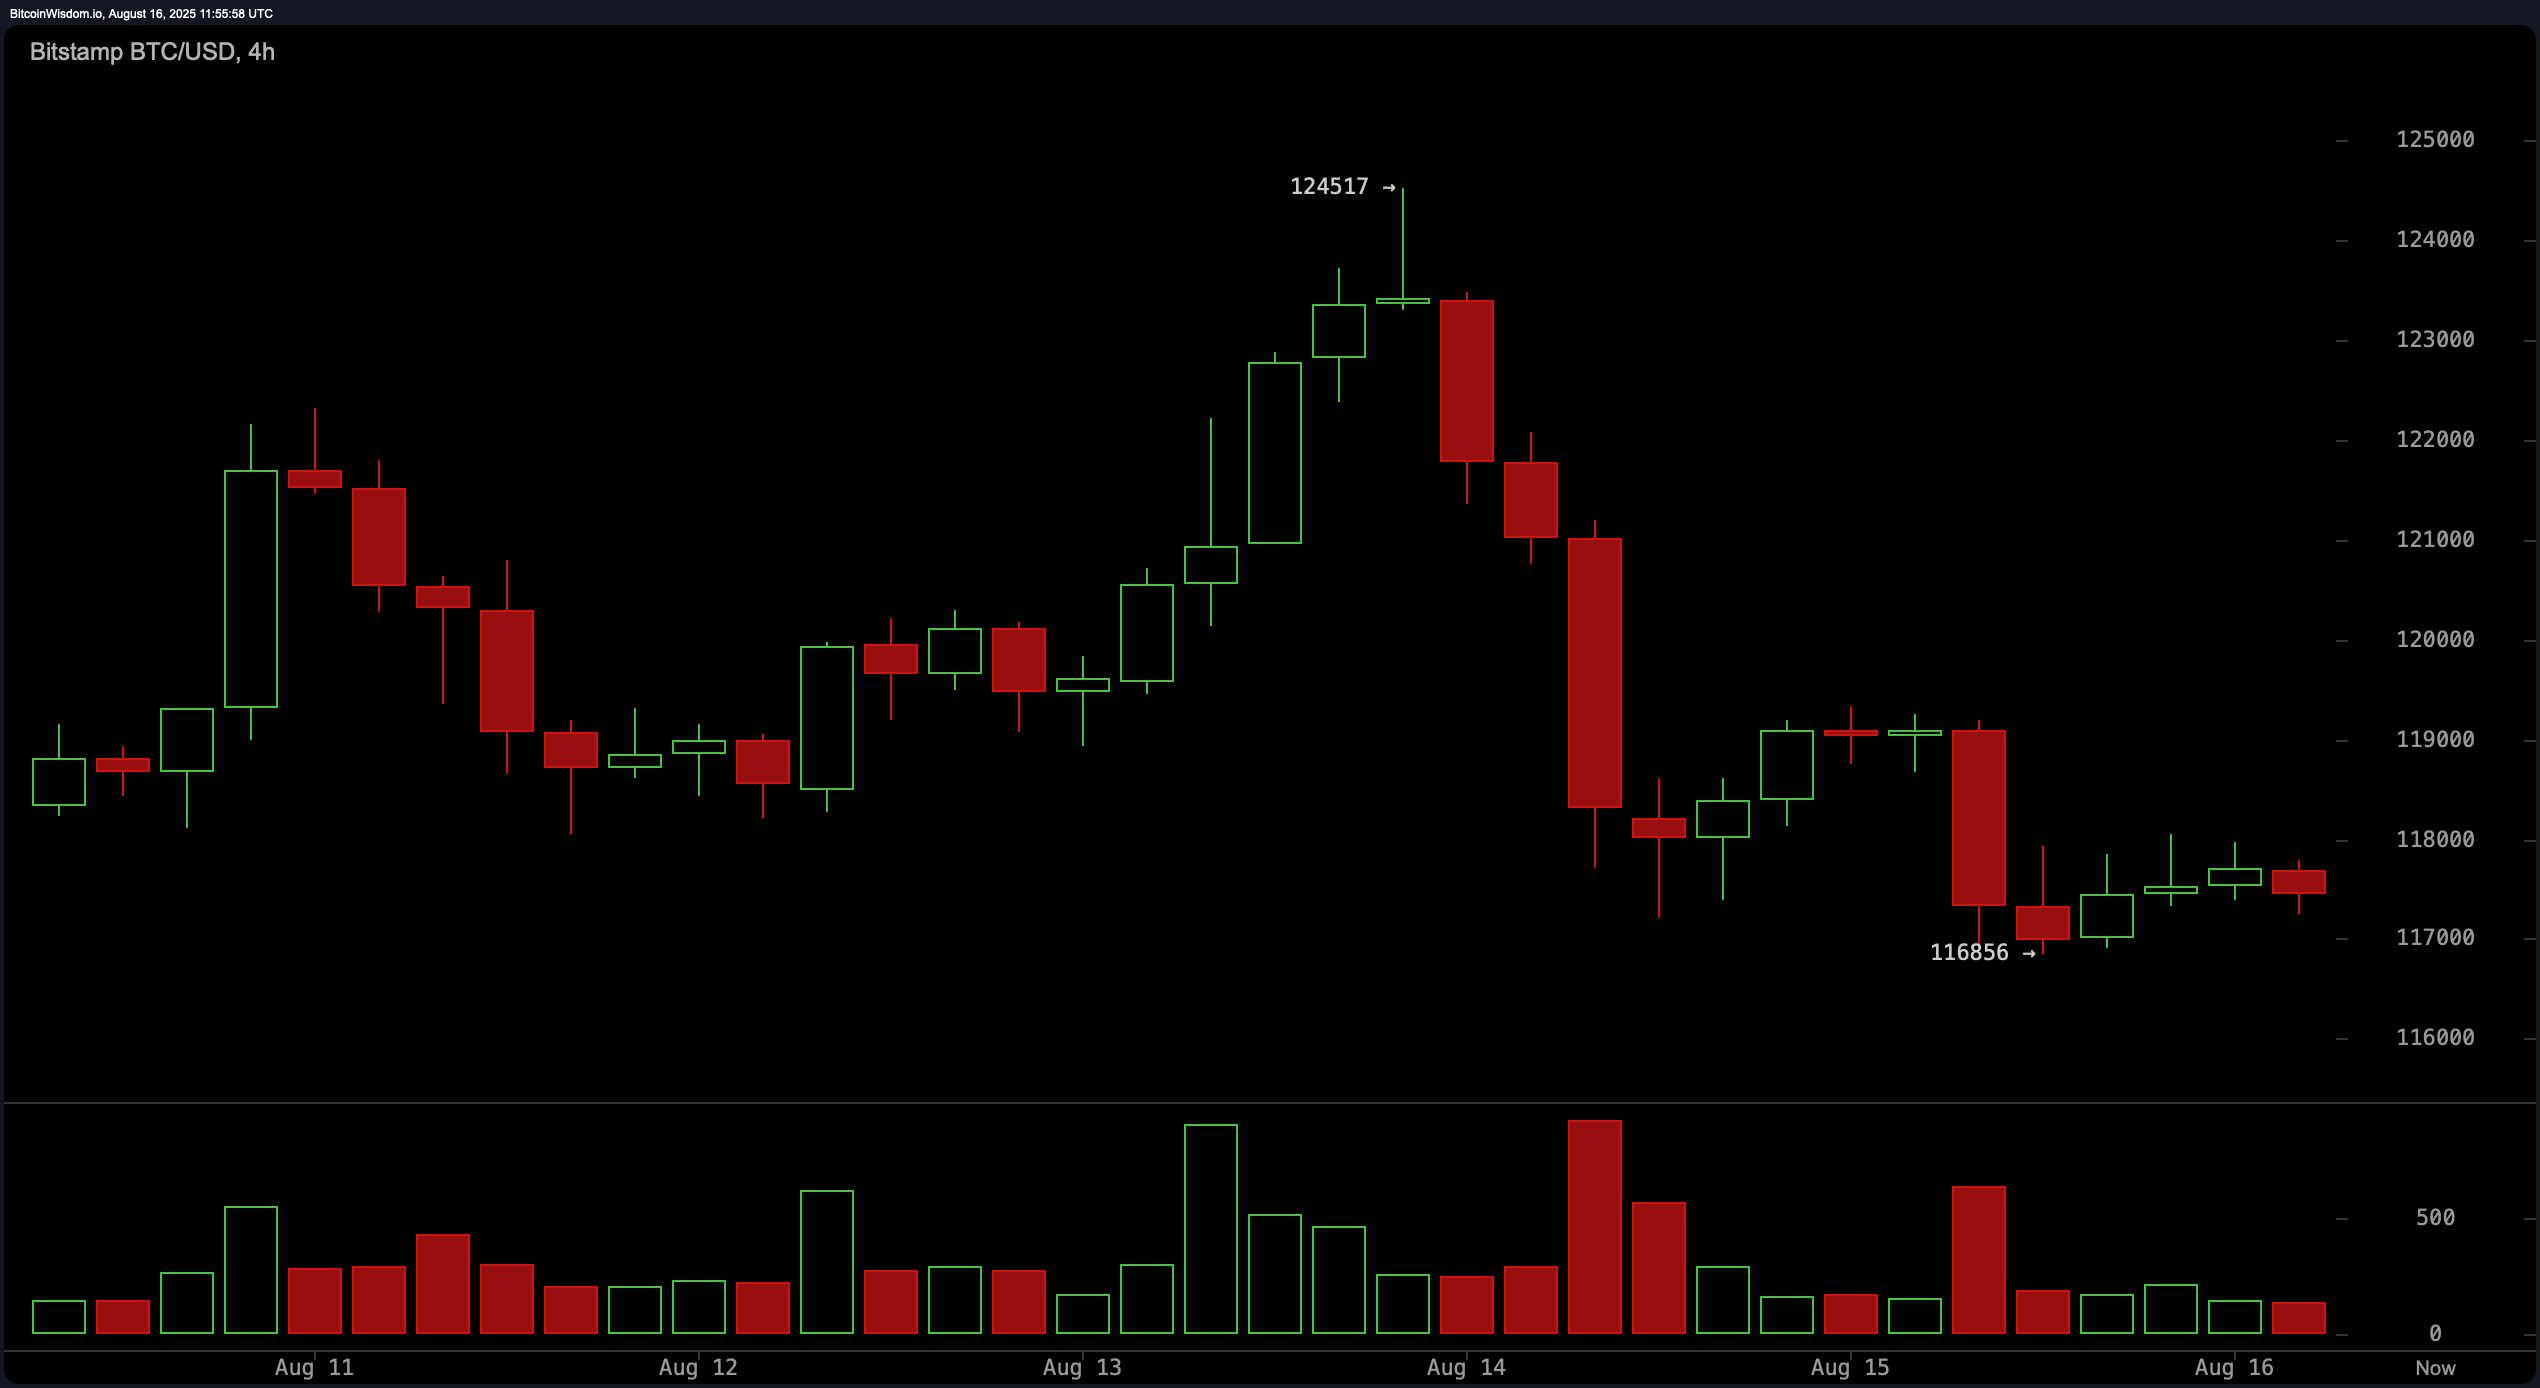
The 4-hour bitcoin chart reflected a pronounced sell-off from the $124,517 high down to $116,856, after which bitcoin entered a tight consolidation band between $117,000 and $119,000. This range-bound behavior indicated market indecision, typically seen as a digestion phase after strong momentum. A sustained breakout above $119,500 could signal a short-term rebound, with $121,000 as the immediate resistance. However, a breakdown below $116,500 on strong volume would likely accelerate the downside to the $114,000–$111,000 range.
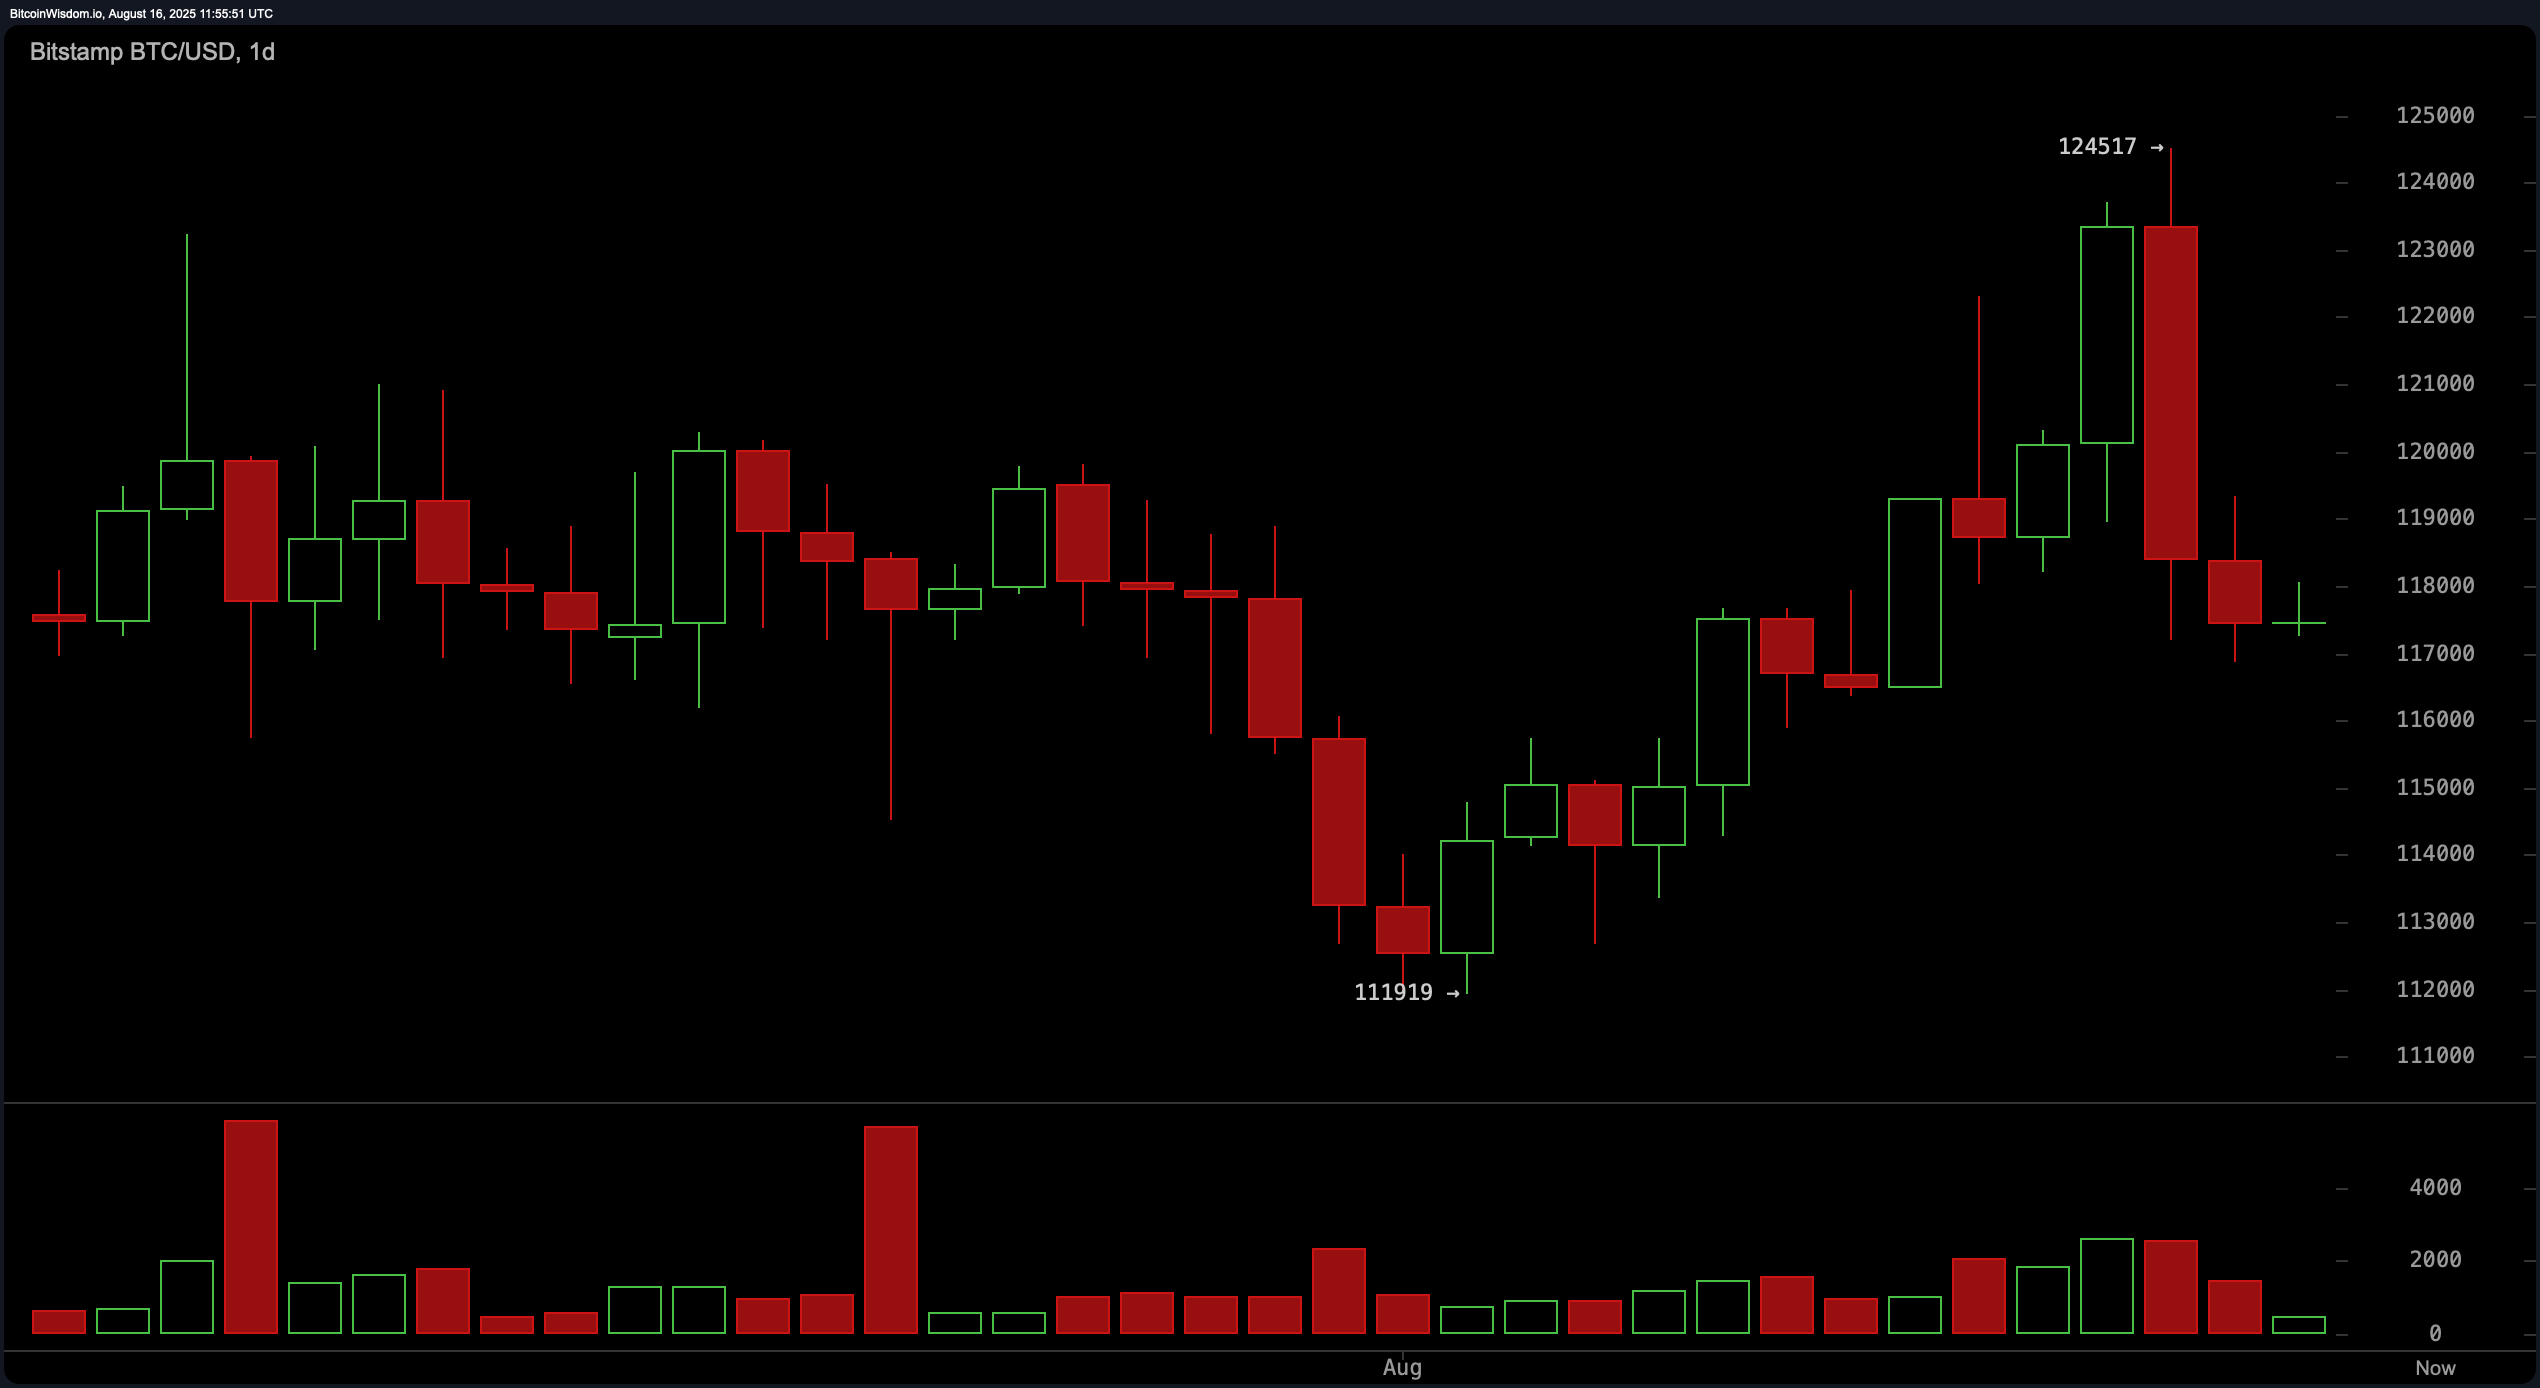
The daily bitcoin chart highlighted a swing high of $124,517 followed by a strong bearish engulfing candle, which often precedes trend reversals. Bitcoin’s failure to maintain its position above $124,000, coupled with volume spikes at the top, pointed toward distribution. A support zone emerged around $117,000, acting as a critical decision level. If price action resumes upward momentum and closes above $119,000 with significant volume, a renewed rally might materialize; otherwise, further deterioration toward the $114,000–$111,000 region is probable.
Oscillator data supported a cautious stance. The relative strength index ( RSI), Stochastic oscillator, commodity channel index (CCI), average directional index (ADX), and awesome oscillator all signaled neutral conditions, suggesting equilibrium in market momentum. The momentum indicator alone leaned bearish, issuing a sell signal. Notably, the moving average convergence divergence ( MACD) diverged from this sentiment, flashing a bullish signal, implying potential for mean reversion or short-term correction if validated by price action.
A breakdown of moving averages revealed a mixed technical landscape. Shorter-term averages, such as the 10-period exponential moving average (EMA) and 10-period simple moving average (SMA), positioned above the current price, signaled bearish conditions. However, mid- and long-term indicators were more favorable: the 30-period and 50-period EMAs and SMAs, along with the 100-period and 200-period variants, all issued bullish signals. This divergence suggested that while the short-term trend leaned bearish, the broader market context remained supportive of upward price potential, pending a decisive shift in momentum.
Bull Verdict:
While bitcoin currently trades below several short-term moving averages and struggles to regain momentum, longer-term technical indicators remain supportive. If buyers can reclaim the $119,000 level with strong volume confirmation, it could trigger a short-term reversal and a potential rally toward the $122,000–$124,000 range. Bullish momentum would be further supported by the buy signal on the moving average convergence divergence ( MACD) and the alignment of longer-term moving averages pointing upward.
Bear Verdict:
Despite intermittent support around $117,000, bitcoin’s inability to hold higher levels, coupled with neutral-to- bearish oscillator signals and a weakening short-term structure, keeps the market vulnerable to further downside. If price breaks and closes below $116,500 with elevated volume, it opens the door to a drop toward $114,000–$111,000. Until bitcoin decisively reclaims the $119,000 resistance zone, bearish momentum continues to dominate in the near term.