Bitcoin is trading at $102,848, with a market capitalization of $2.05 trillion and a 24-hour trading volume of $59.85 billion. The intraday price range spans from $102,349 to $104,412, reflecting a relatively narrow band of volatility amid consolidative market behavior.
Bitcoin Price Watch: Range Trading Persists as Bulls and Bears Face Off
This article was published more than a month ago. Some information may no longer be current.
WRITTEN BY
SHARE

Bitcoin Chart Outlook
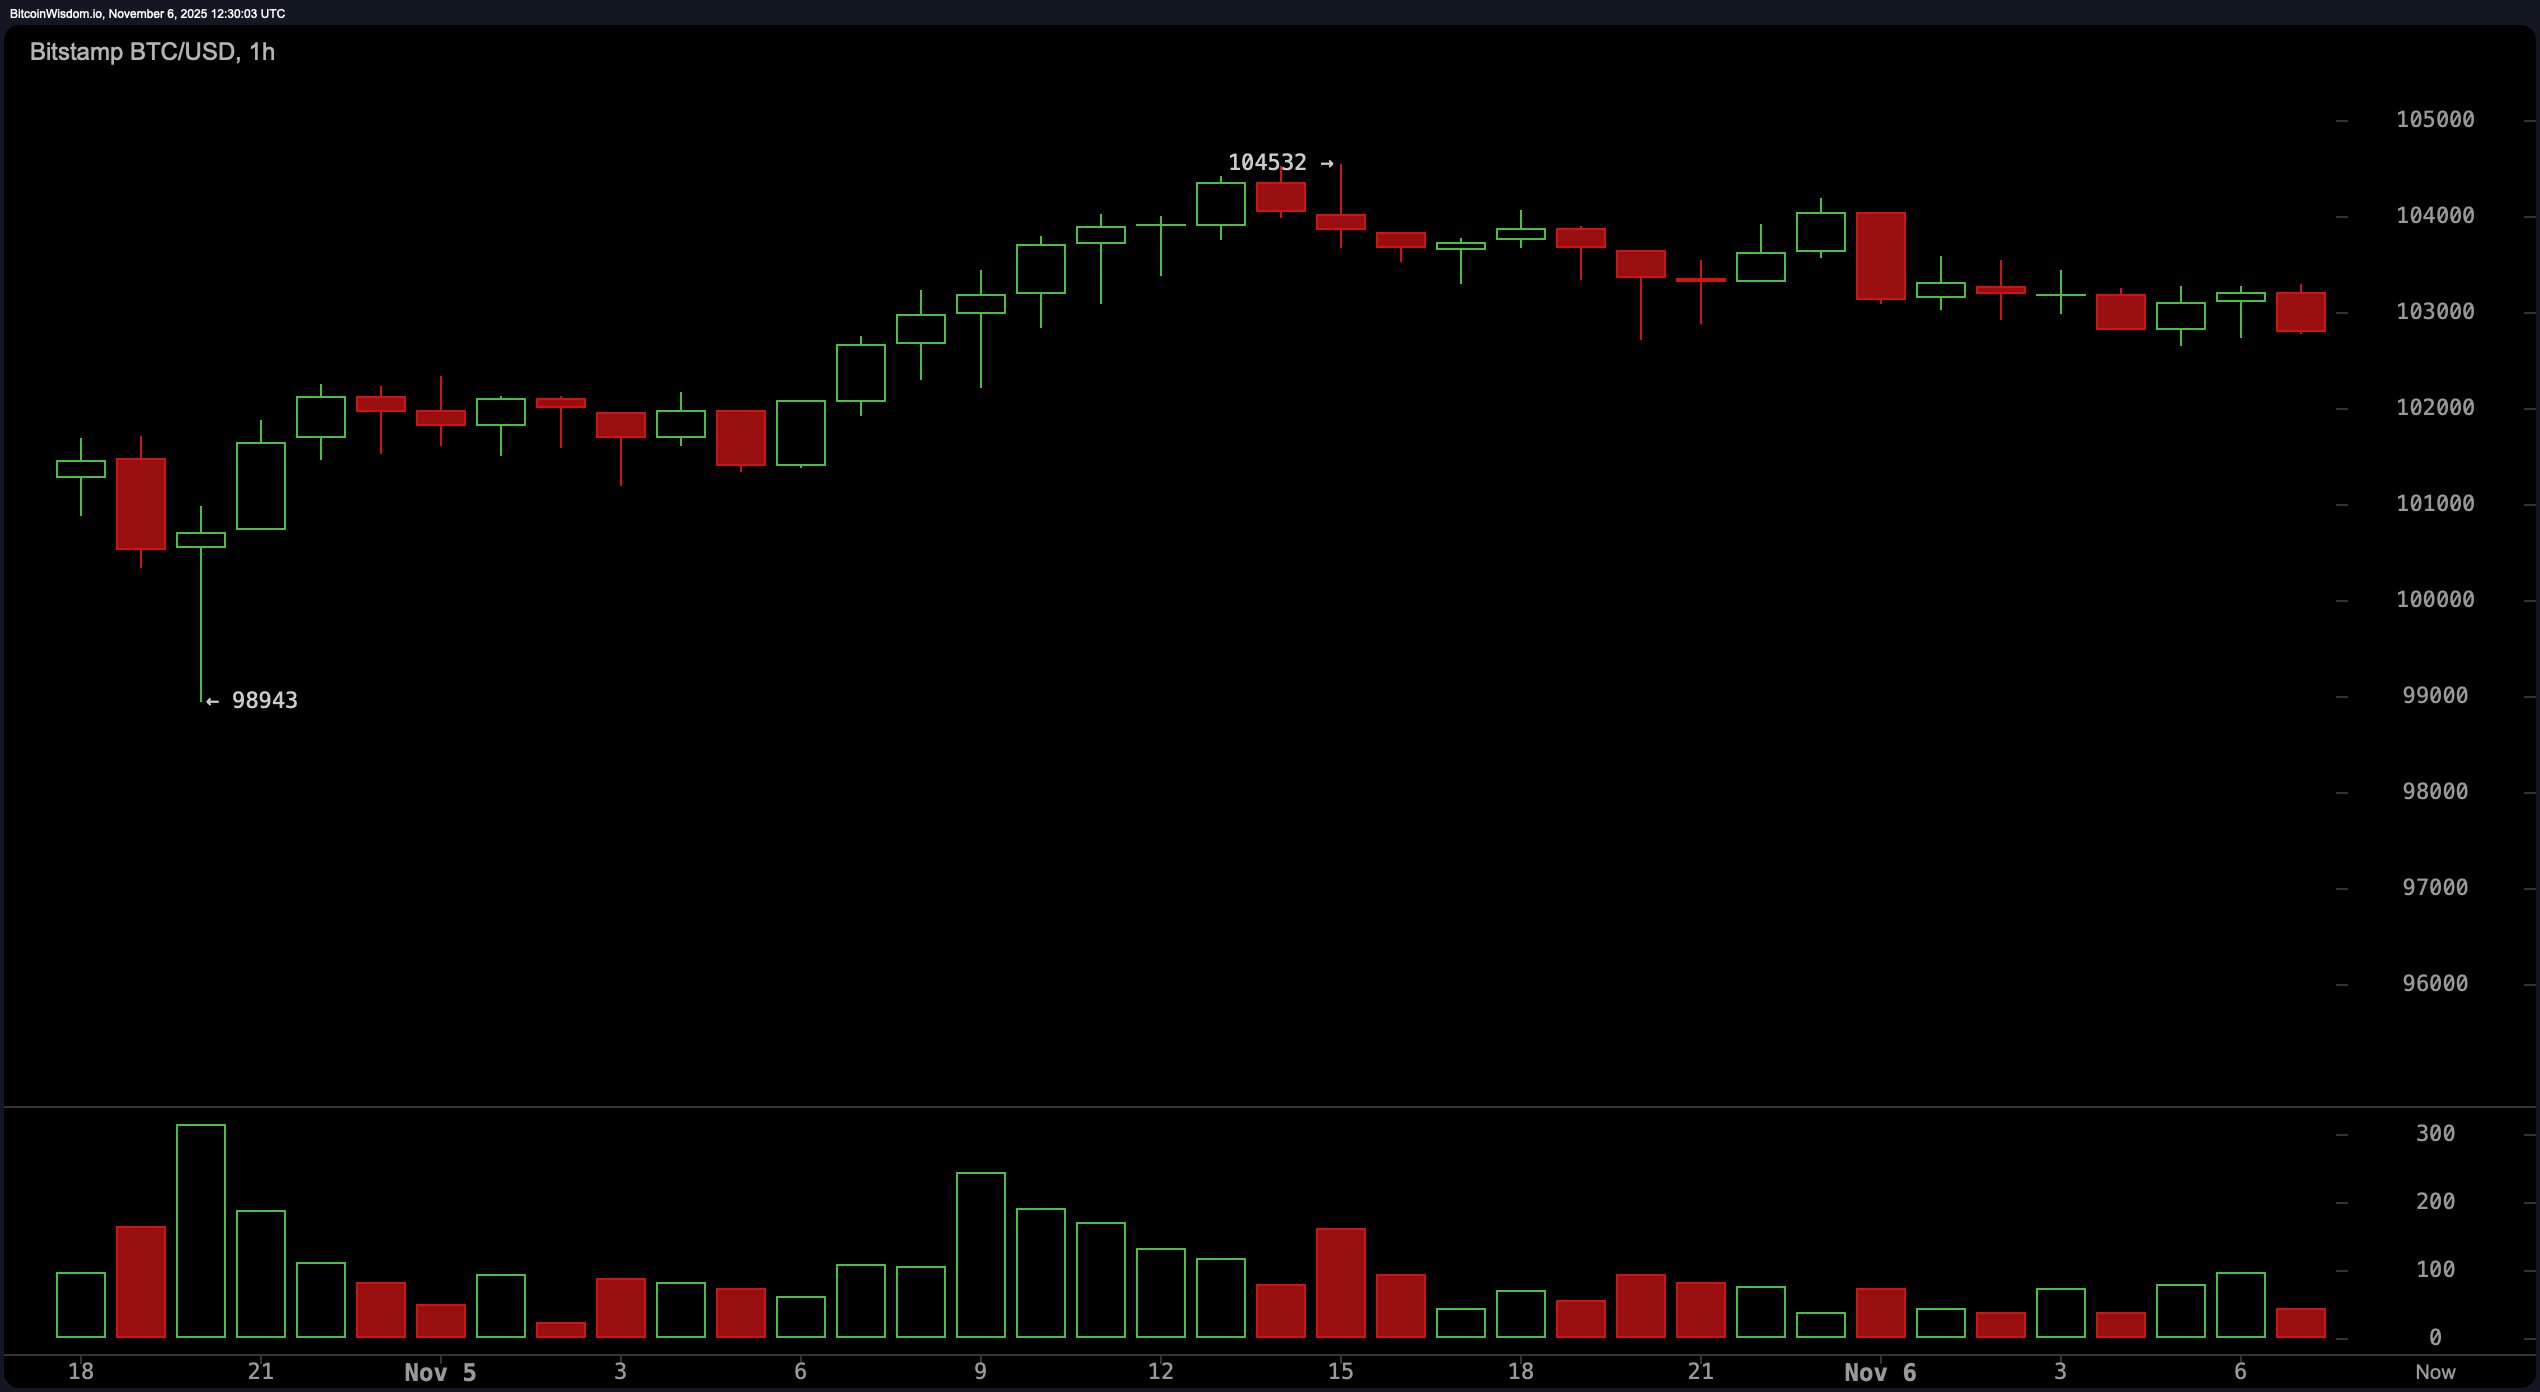
The 1-hour chart illustrates a microstructure dominated by a V-shaped recovery that followed a sharp downward flush below $99,000. Although the initial rebound was swift, price action has since slowed into a sideways range defined by lower highs and weakening volume—a clear sign of buyer fatigue.
The support zone remains near $98,900, where the last aggressive dip attracted strong buying interest, while resistance is forming near $104,500. Without a substantial uptick in volume, further upward movement appears unlikely, and traders are watching closely for price interaction near the $100,000 to $101,000 zone to gauge momentum strength.
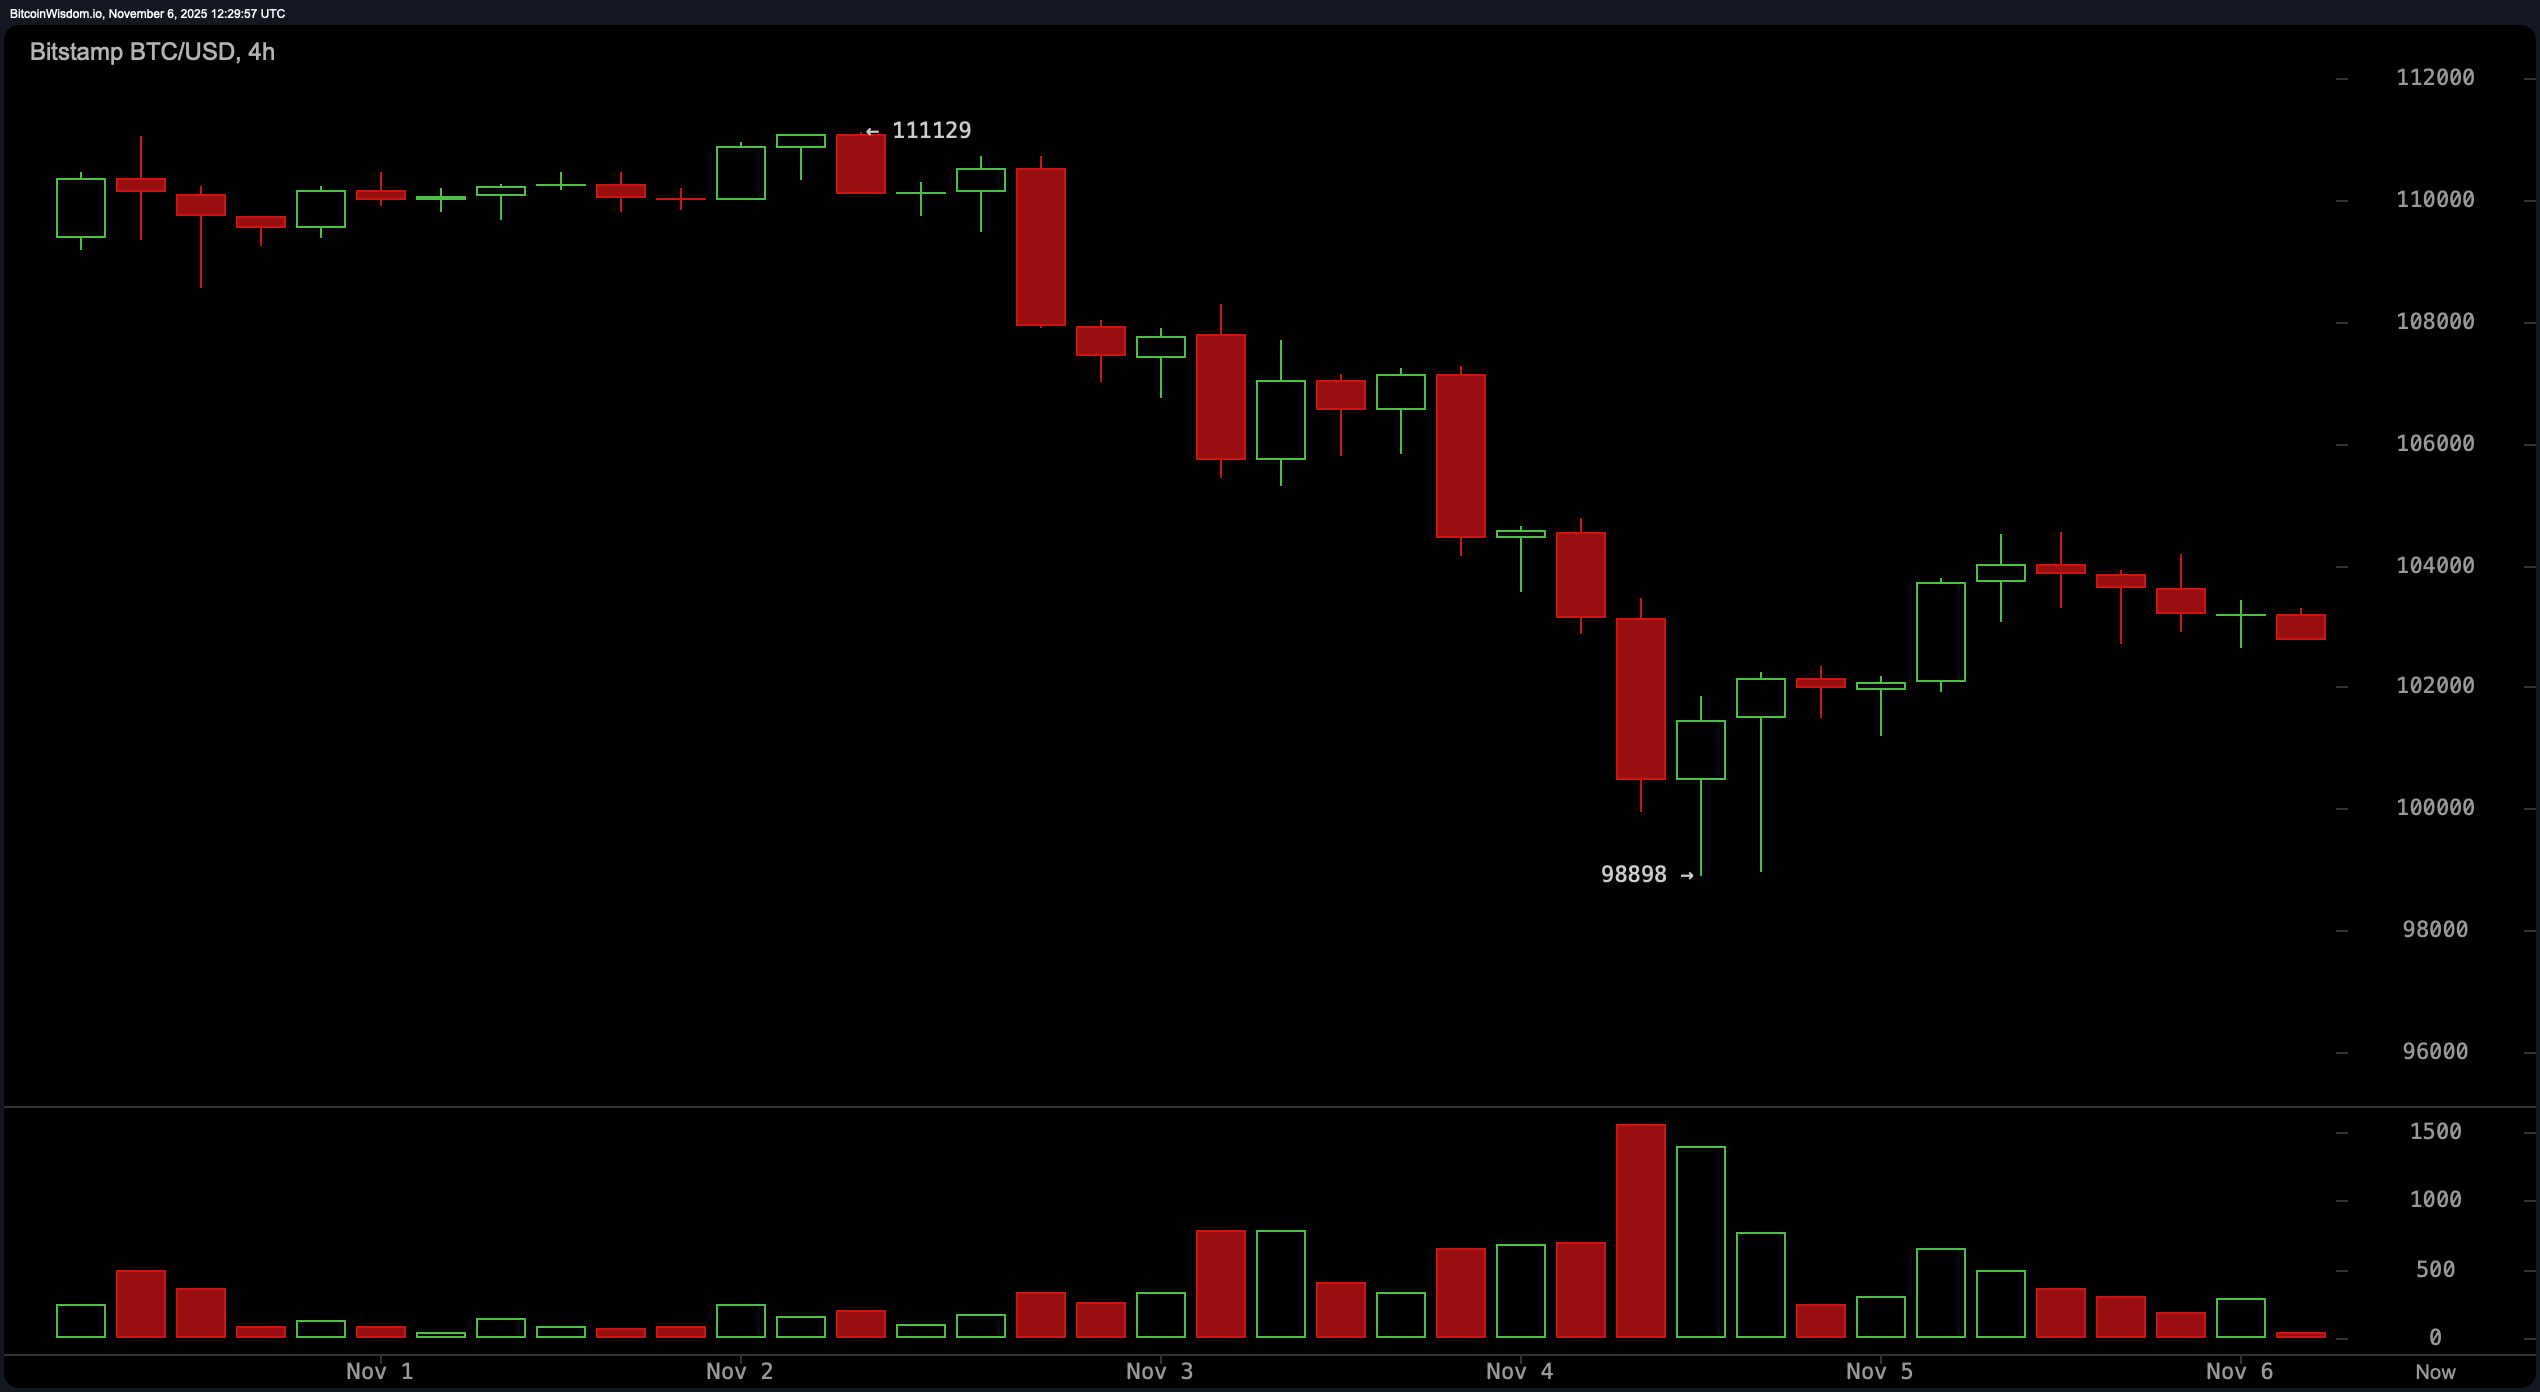
On the 4-hour chart, bitcoin continues to trend within a descending channel, signaling a bearish-to-neutral short-term structure. The top of this structure sits near $111,129, which was heavily rejected in prior sessions, while the bottom at $98,898 is reinforced by significant buying activity. Despite a relief rally attempt, the lack of follow-through and declining green volume bars suggest a possible distribution phase. Holding above $101,000 remains critical; failure to do so could set the stage for another probe below the $99,000 mark. Conversely, reclaiming the $106,000 level with volume would indicate a potential shift toward short-term upside.
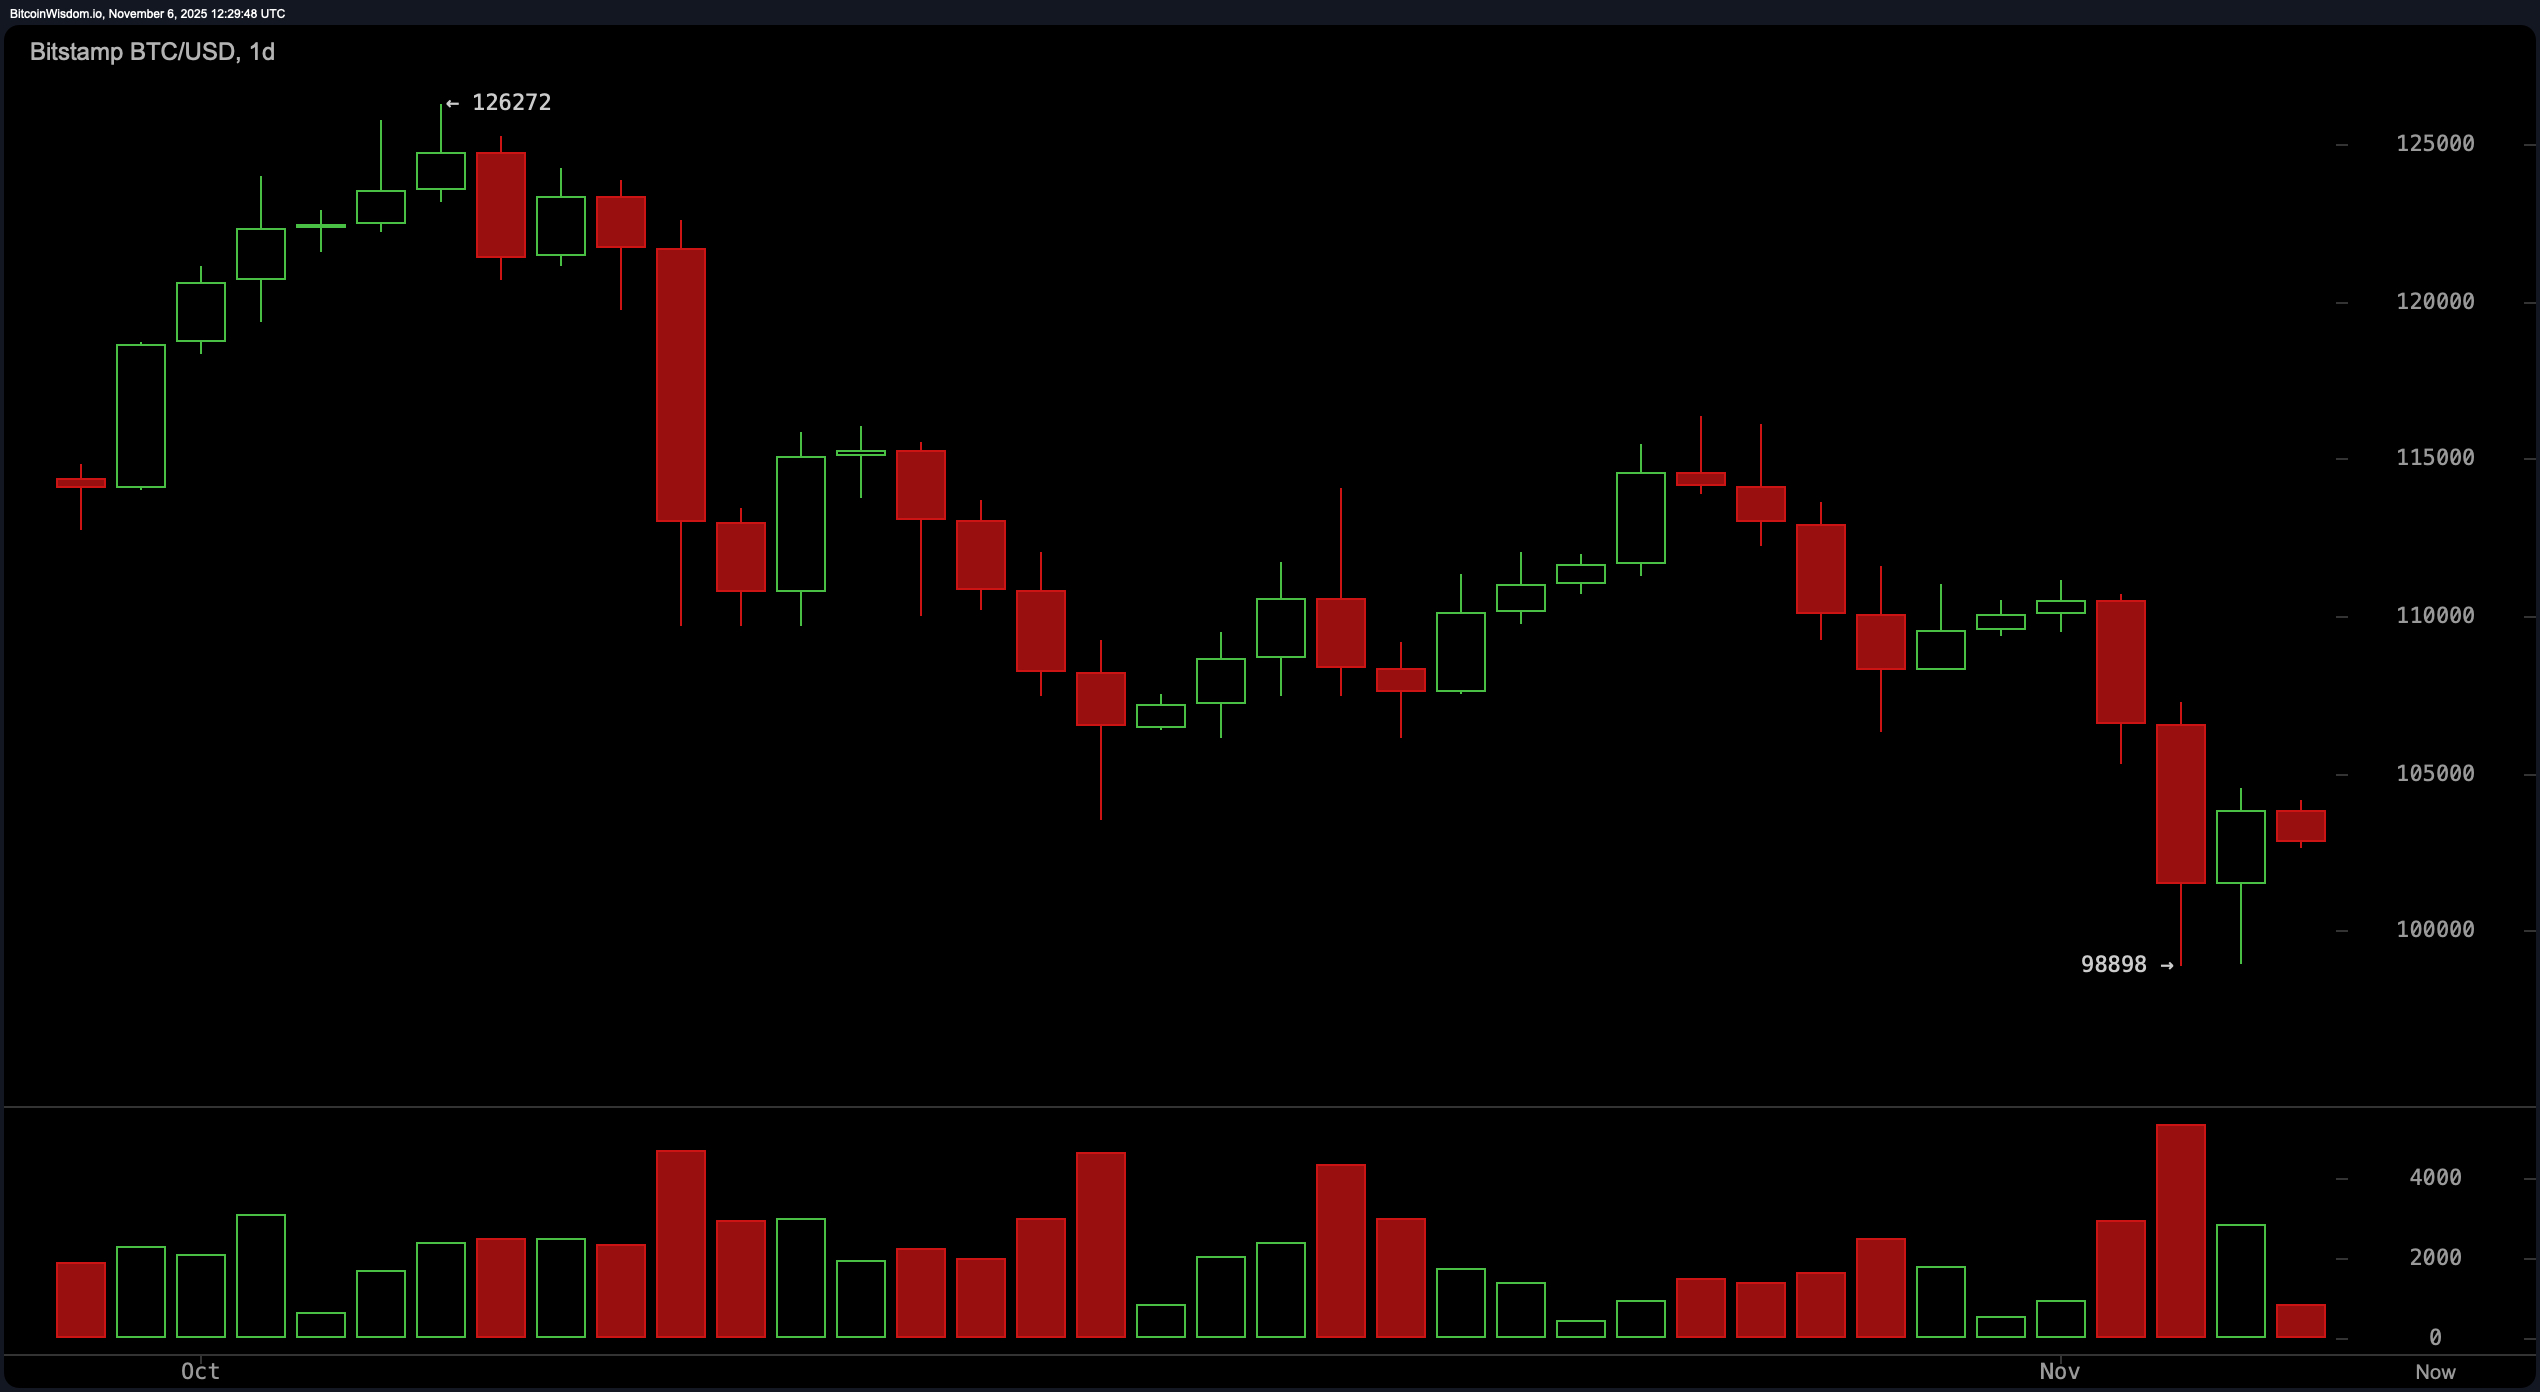
The daily chart presents a more pronounced macro bearish narrative, characterized by a consistent series of lower highs and lower lows. The rejection from $126,272 has cascaded into continued downward pressure, with $98,898 now acting as a vital support floor. The price’s consolidation near $103,000 lacks sufficient bullish volume, suggesting indecision and a potential continuation of the bearish trend. A confirmed daily close above $108,000 to $110,000 would be required to break the macro pattern and establish upward momentum.
From a technical indicator standpoint, oscillators are largely indecisive. The relative strength index ( RSI) is at 36, signaling neutral momentum, while the Stochastic oscillator stands at 22, also neutral. The commodity channel index (CCI) at −153 is the only oscillator indicating potential upside. However, momentum at −11,314 and the moving average convergence divergence ( MACD) at −2,375 are both aligned with continued downward bias. Additionally, the Awesome oscillator reads −6,986, and the average directional index (ADX) at 22 suggests a weak trend strength overall.
Moving averages reinforce the bearish positioning. All major exponential moving averages (EMA) and simple moving averages (SMA) from the 10-period to the 200-period are currently above the spot price and indicate downside pressure. The 10-period EMA is at $106,667, while the 200-period EMA stands at $108,228. Similarly, the 10-period SMA is at $107,611, and the 200-period SMA at $110,136—each providing layered resistance that bitcoin must overcome to shift sentiment more favorably.
In summary, bitcoin remains in a technically fragile state, caught between key support near $99,000 and overhead resistance just above $108,000. Momentum signals favor caution, with no confirmed bullish reversal yet established. Volume remains the key trigger for directional conviction, and traders are closely monitoring whether the $98,000 floor will hold or if the asset will reclaim levels necessary to challenge the broader downtrend.
Bull Verdict:
If bitcoin maintains its footing above the $98,000 support and manages a decisive break above $110,000 on rising volume, the technical landscape could shift in favor of a recovery. A close above this level would disrupt the current downtrend structure and signal renewed accumulation interest, potentially setting the stage for a move toward prior highs in the $120,000 range.
Bear Verdict:
Should bitcoin lose the critical $98,000 support level, the prevailing downtrend will likely accelerate, with downside targets between $92,000 and $94,000 becoming increasingly probable. With all major moving averages positioned above current price action and momentum indicators skewed to the downside, the path of least resistance remains lower unless a clear reversal develops.
FAQ
- Where is bitcoin trading right now?
Bitcoin is trading around $102,848 as of Nov. 6, 2025. - What is the current support level for bitcoin?
Key support is holding near $98,000, a level tested multiple times recently. - What price zone could signal a trend reversal?
A move above $110,000 with volume may indicate a potential reversal. - Are indicators suggesting further downside?
Most moving averages and momentum indicators point to continued bearish pressure.