Bitcoin is priced at $91,667 on Nov. 20, 2025, at 8 a.m. Eastern time, with a market capitalization of $1.82 trillion and a hefty 24-hour trading volume of $85.22 billion. It danced within a volatile intraday range between $88,540 and $92,943—enough of a swing to rattle even the steadiest hands.
Bitcoin Price Watch: Descending Channels and a $102K Ceiling
This article was published more than a month ago. Some information may no longer be current.
WRITTEN BY
SHARE

Bitcoin Chart Outlook
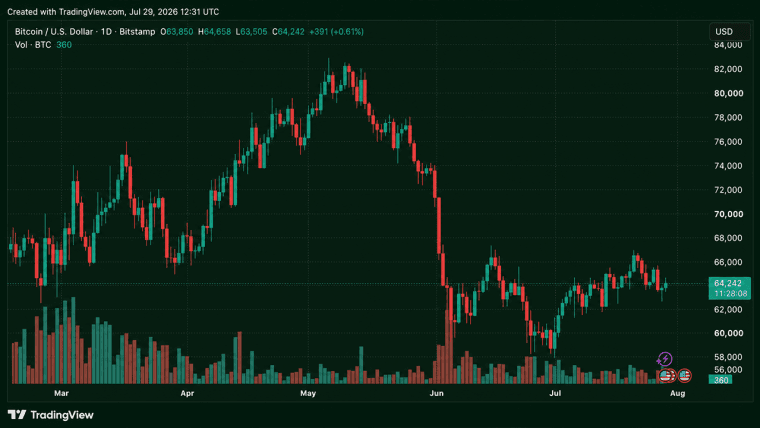
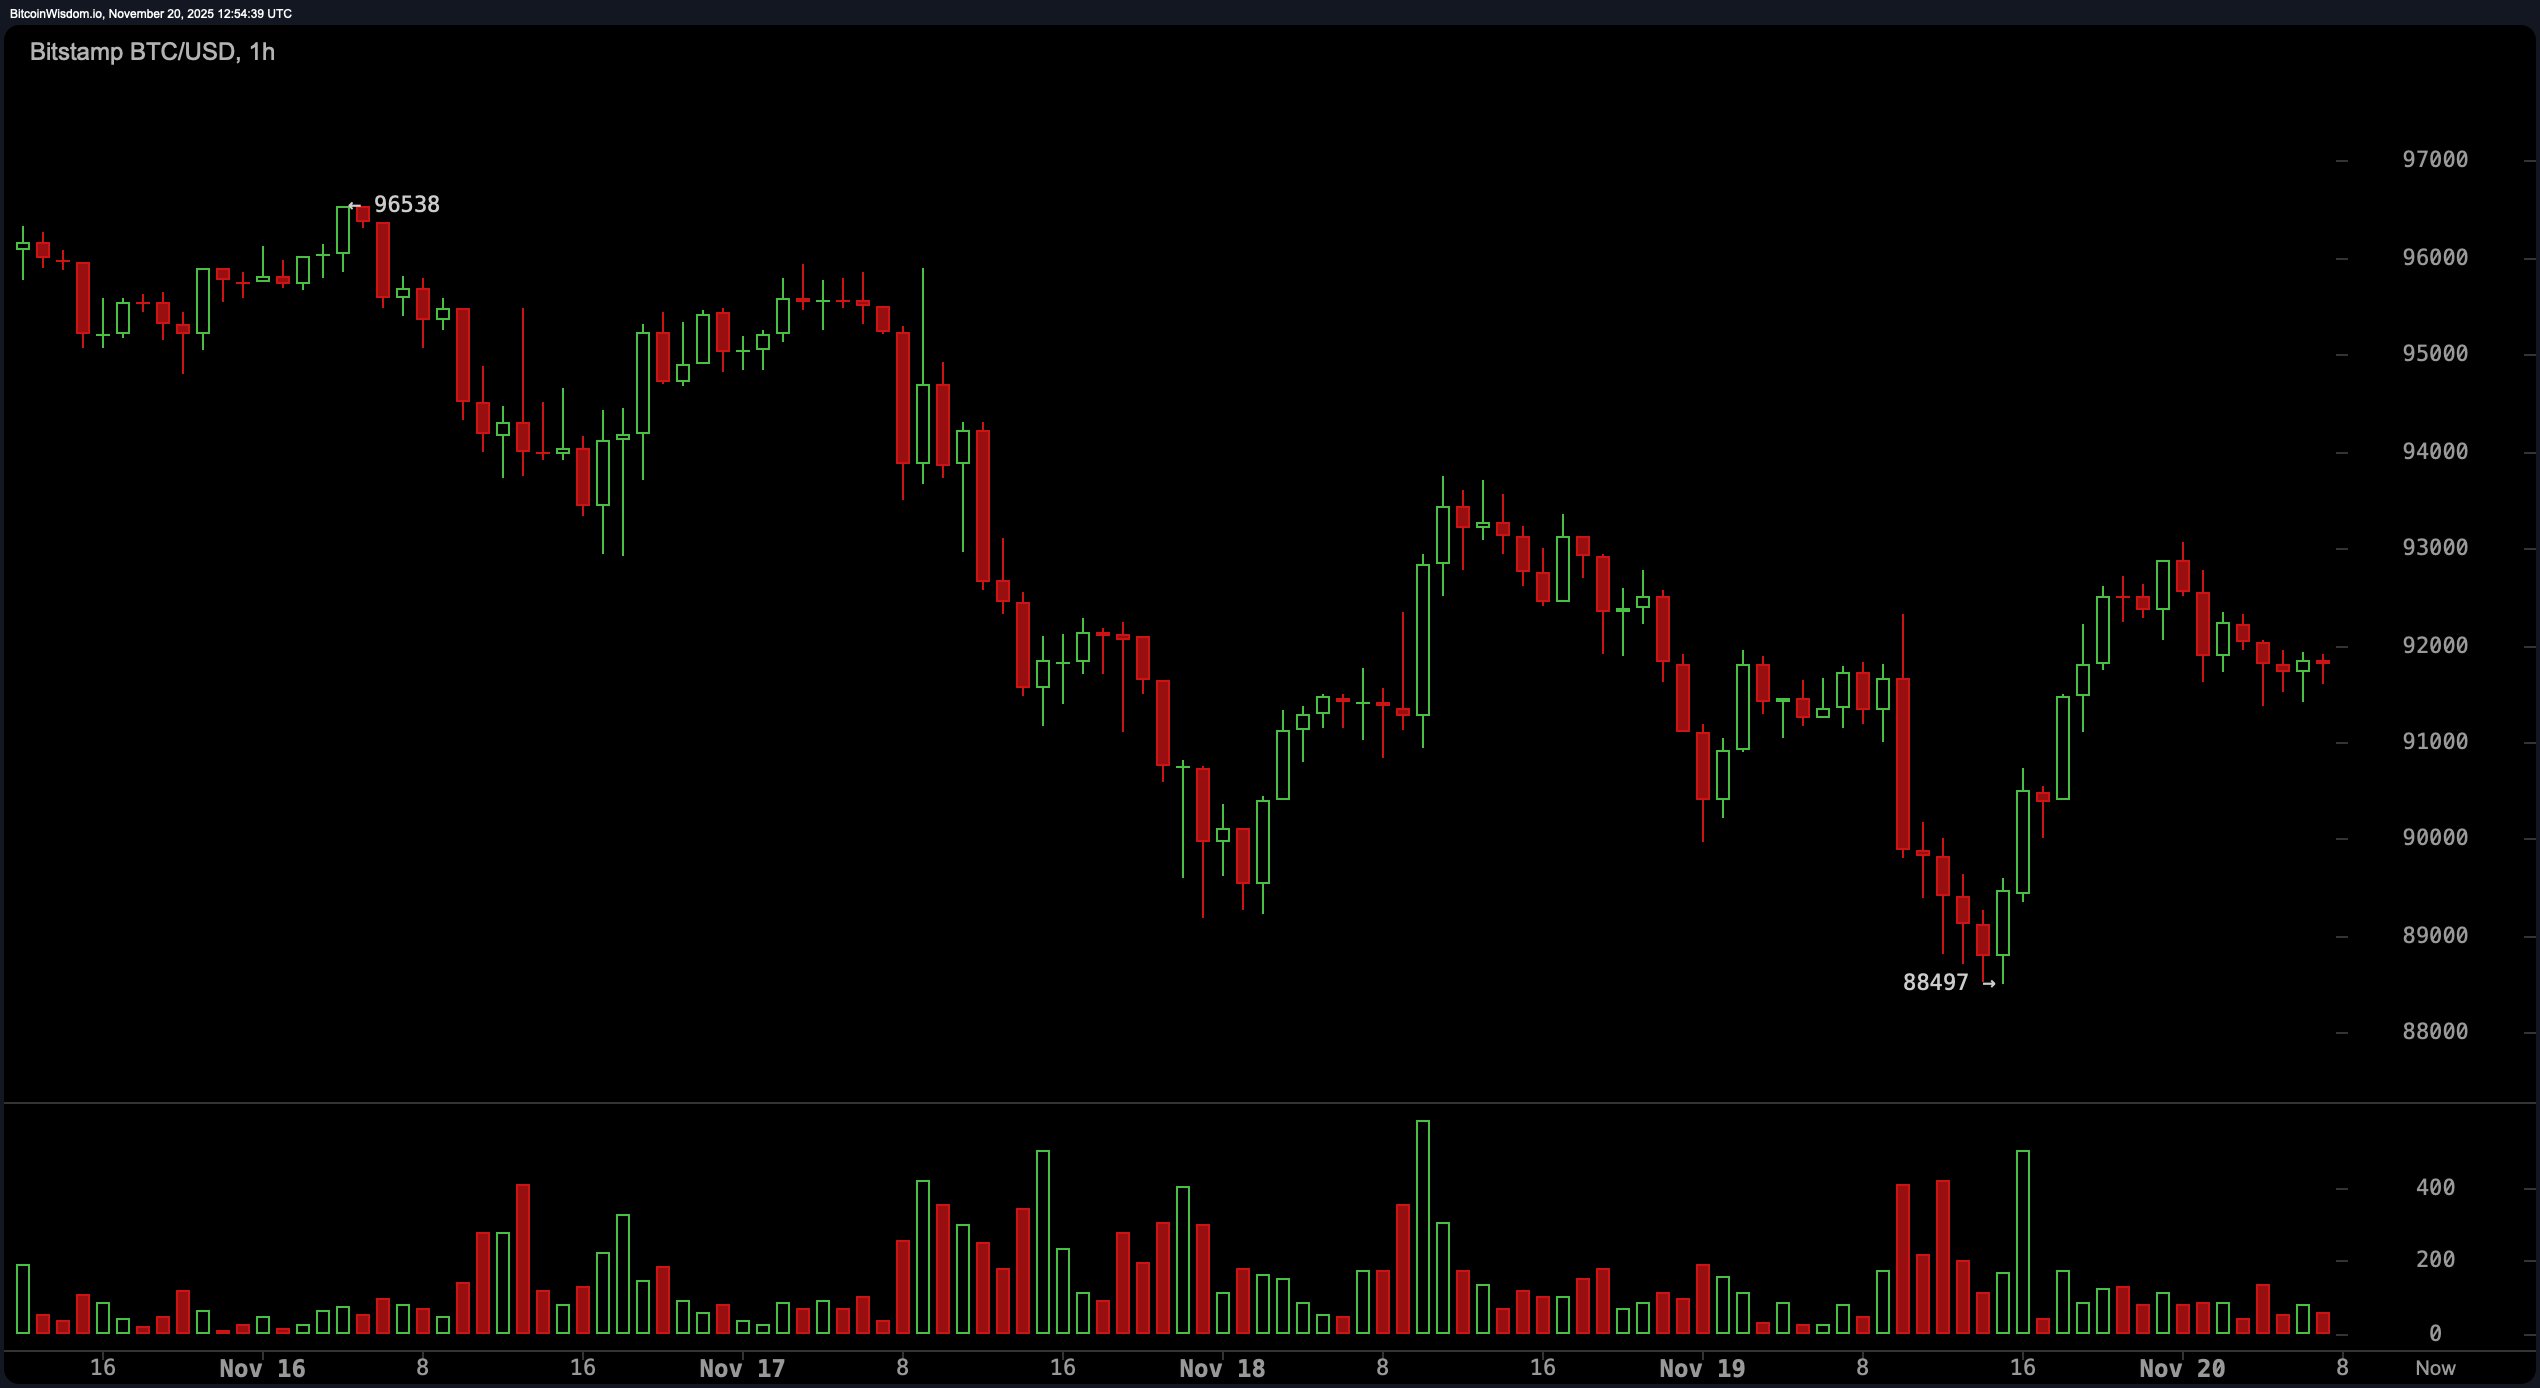
Zooming out to the daily chart, bitcoin appears to be in no rush to reclaim its former glory. Since peaking around $126,272 in early October, it has endured a relentless descent, settling near $88,497. The formation resembles a textbook descending channel, perhaps even a double top breakdown—both bearish cues for chart enthusiasts.
Volume spikes during sell-offs suggest that panic, not poise, has been steering this ship. Support holds precariously around the $88,000 to $90,000 zone, while resistance overhead looms large between $98,000 and $102,000.

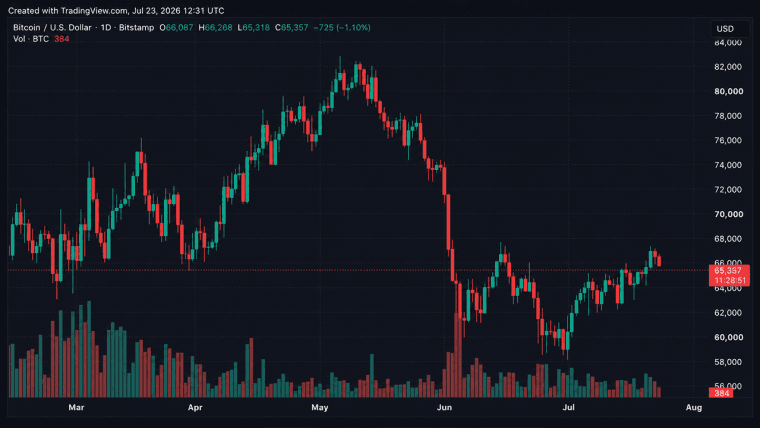
On the four-hour chart, the landscape softens slightly. While the broader trend remains bearish, momentum appears to be limping toward exhaustion. Some green volume spikes offer a glimmer of hope, hinting at possible short-covering or stealth accumulation. A rounding bottom is taking shape, and if bitcoin can close above $92,500–$93,000 with meaningful volume, that could signal a short-term reversal. But beware: the $98,000 mark still marks the threshold where many bulls lose their nerve.

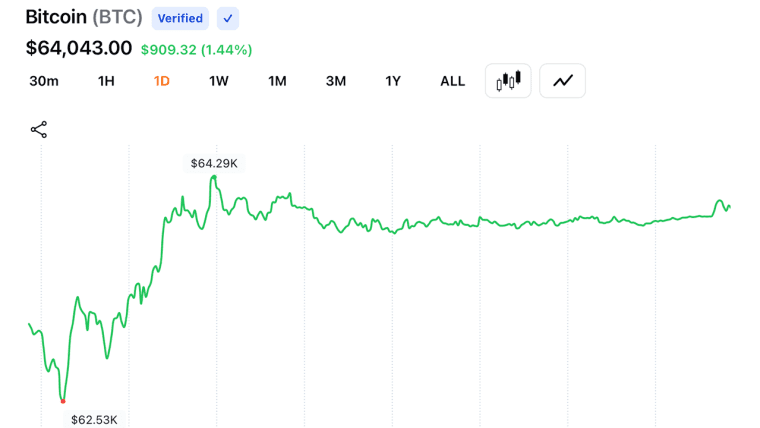
The one-hour chart is where things get interesting. A series of higher lows suggests that a local reversal attempt is underway. Green volume bars offer confirmation, and an inverse head and shoulders pattern is tiptoeing onto the scene between Nov. 18 and 20. A breakout above $92,500 would be the go-ahead for a push toward the $96,000 target—so long as traders maintain their composure and keep an eye on that $90,000 stop-loss line.
Indicators paint a picture that’s more “wait and watch” than “dive right in.” The relative strength index (RSI) sits at a neutral 30, while the Stochastic oscillator loiters at 18, also neutral. The commodity channel index (CCI) is at −115, suggesting a potential recovery, but the momentum indicator at −14,170 and moving average convergence divergence (MACD) level at −4,727 aren’t exactly throwing a party. All major moving averages—from the exponential moving average (EMA) 10 to the simple moving average (SMA) 200—are unanimously unfriendly, clocking in well above the current price and urging caution.
In sum, this is a bear market bounce in progress, not a phoenix rising just yet. Unless bitcoin mounts a convincing move above $102,000 and camps out there with strong volume, this show remains a cautiously optimistic intermission in an otherwise downward production. Watch those breakouts like a hawk—without volume, they’re just shadows on the wall.
Bull Verdict:
If bitcoin breaks above $92,500 with conviction and pushes past the $98,000 resistance zone, there’s potential for a short-term rally toward $102,000. Volume confirmation is non-negotiable—without it, any breakout is just wishful thinking dressed as momentum.
Bear Verdict:
With all major moving averages pointing down and momentum indicators like the MACD and momentum index flashing red, the prevailing trend remains bearish. A breakdown below $88,000, especially with volume backing it, could accelerate the fall and send bitcoin hunting for lower support zones.
FAQ 💡
- What is bitcoin’s current price as of Nov. 20, 2025?
bitcoin is priced at $91,667 with a 24-hour range between $88,540 and $92,943. - Is bitcoin in a bullish or bearish trend right now?
The trend is predominantly bearish, with all major moving averages above current price levels. - Where is key support for bitcoin on the charts?
Strong support lies around the $88,000 to $90,000 range. - What could signal a short-term reversal in bitcoin?
A breakout above $92,500 with confirmed volume could indicate bullish momentum.