Bitcoin traded in a tight band between $117,705 and $118,091 over the last hour, as bullish momentum continues to ripple through the crypto market. The leading cryptocurrency holds a market cap of $2.34 trillion, with 24-hour trading volume at $81.33 billion and an intraday price range between $110,768 and $118,839, highlighting a broad and volatile trading session.
Bitcoin Price Watch: Bulls Target $120K Amid Strong Technical Breakout
This article was published more than a month ago. Some information may no longer be current.
WRITTEN BY
SHARE

Bitcoin
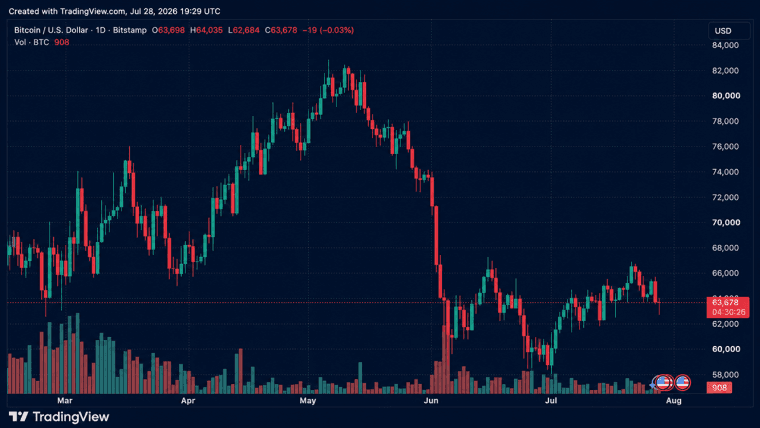
On the daily chart, bitcoin exhibits strong bullish momentum, confirmed by a breakout above the former resistance of $112,000. The move is supported by a volume spike, signaling conviction in the uptrend. The latest candlesticks point to persistent buying interest following a bottom at $98,240. Current price action suggests a likely attempt to break through psychological resistance near $119,000, with optimal long positions ideally entered on a pullback toward the $112,000 to $114,000 range. Target zones lie between $119,000 and $121,500, contingent on continuation strength.

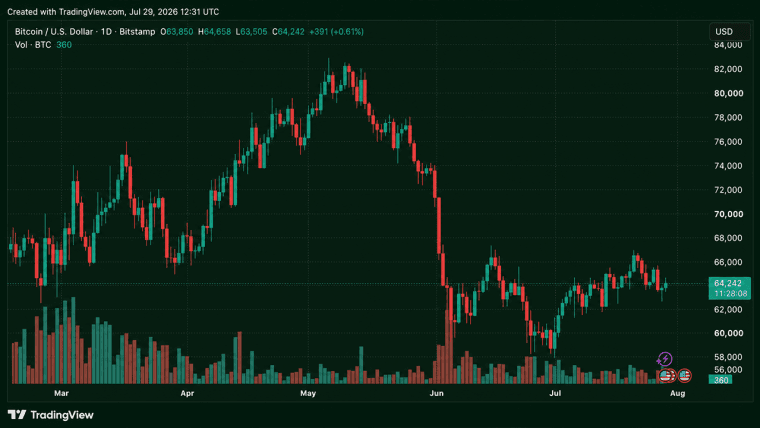
The 4-hour BTC/USD chart supports this bullish outlook, displaying a clear impulse leg from approximately $111,000 to over $118,000. A bull flag formation has developed, indicating healthy consolidation rather than reversal. Trading volume aligns with this narrative—higher during breakout and subdued during consolidation. Entry signals emerge on a breakout above $118,800 or a dip back toward $115,000 to $116,000, while resistance between $120,000 and $121,500 remains critical. No immediate signs of bearish reversal are present, affirming short- to mid-term upside potential.

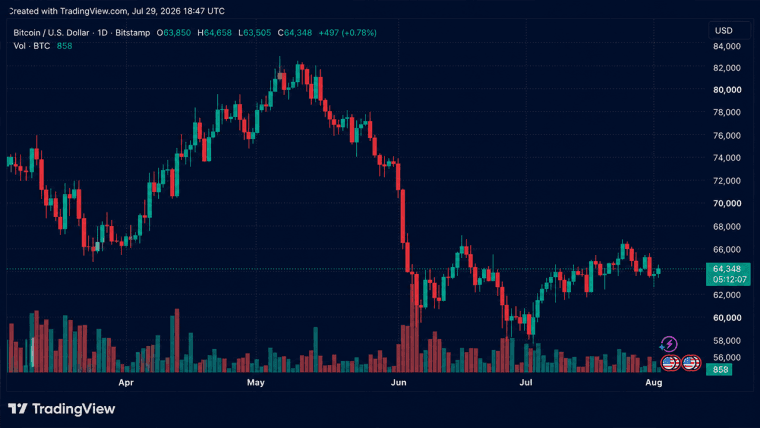
From the hourly perspective, bitcoin shows signs of exhaustion as price action slows near $118,800. The chart features a parabolic advance, now encountering early bearish candles that hint at a possible short-term correction. High breakout volume has since tapered, suggesting a potential loss of momentum. Traders are advised to hold off on initiating new longs and instead consider re-entry near $116,000 if confirmed by support holding. Alternatively, short-term scalping opportunities may exist below $118,000 with quick exits near $117,000, particularly if selling intensifies.

Oscillators present a largely neutral stance across key indicators. The relative strength index (RSI) is elevated at 74 but still neutral, implying an overbought environment without triggering sell signals. Stochastic stands at 91 and the commodity channel index (CCI) at 291—both neutral yet elevated. The average directional index (ADX) is modest at 15, indicating a trend lacking strong conviction despite the price surge. However, momentum (10) at 12,255 and the moving average convergence divergence (MACD) level (12, 26) at 2,184 both flash bullish signals, suggesting potential continuation.
All major moving averages point to a strong bullish trend. The exponential moving averages (EMAs) and simple moving averages (SMAs) across 10, 20, 30, 50, 100, and 200 periods uniformly generate positive signals, reflecting a strong trend alignment across short to long timeframes. The 10-period EMA at $111,496 and the 10-period SMA at $110,654 provide immediate short-term support, with deeper support anchored by the 200-period EMA and SMA at $96,237 and $96,812, respectively. These technical levels offer layered price floors in case of a broader pullback.
Bull Verdict:
Bitcoin remains in a well-defined uptrend with strong support from all major moving averages and buy signals from key momentum indicators such as the momentum (10) and the moving average convergence divergence (MACD). The bullish breakout above $112,000, sustained volume, and technical formations on the daily and 4-hour charts suggest that further gains toward $120,000 and potentially beyond remain likely, especially if resistance near $118,800 is cleared decisively.
Bear Verdict:
Despite the prevailing uptrend, short-term signals from the hourly chart hint at exhaustion near recent highs, with bearish candles and waning volume raising the risk of a near-term pullback. Overbought oscillator readings and the psychological resistance zone around $119,000 could trigger profit-taking or temporary weakness, particularly if price fails to maintain support above $116,000.