Bitcoin price is rangebound today between $88,990 to $89,473 over the last hour, perched just below the psychological $90K marker as traders wrangle over its next move. With a market capitalization of $1.78 trillion and a 24-hour trading volume of $21.62 billion, the coin remains the heavyweight champ of crypto—though its footing looks increasingly cautious. Intraday, bitcoin ranged between $88,976 and $90,130, proving once again that sideways isn’t always stable—sometimes it’s just lost.
Bitcoin Price Watch: Bulls Stall Below $90K While Bears Lick Their Chops
This article was published more than a month ago. Some information may no longer be current.
WRITTEN BY
SHARE

Bitcoin Chart Outlook
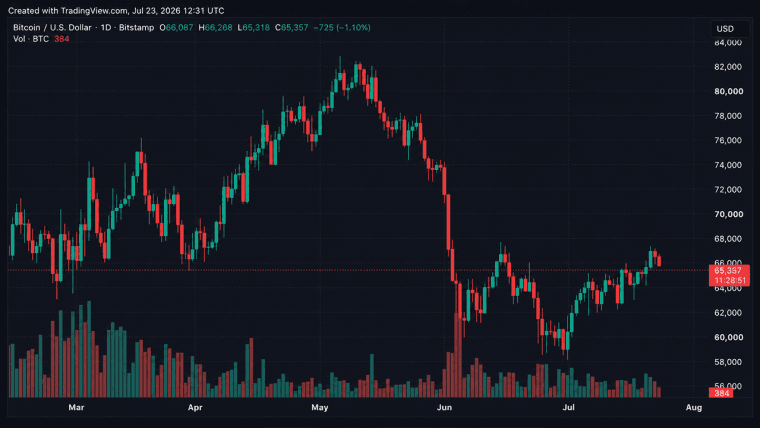
The daily chart paints a classic tale of downward drift meeting uncertain consolidation. Since sliding from a lofty high of approximately $111,129 to a trough near $80,537, bitcoin has been treading water in the $90K territory, like a washed-up surfer waiting for the next big wave. Volume tells its own story: the drop came with aggressive red-candle panics, while bullish reversals have lacked spine.
Key support lies in the $80,500 to $82,000 band—cue double bottom speculation—while resistance clings tightly around $95,000 to $96,000, a zone bitcoin has knocked on but never entered. Until bulls break that ceiling with conviction and volume, the broader trend remains flat at best, fragile at worst.

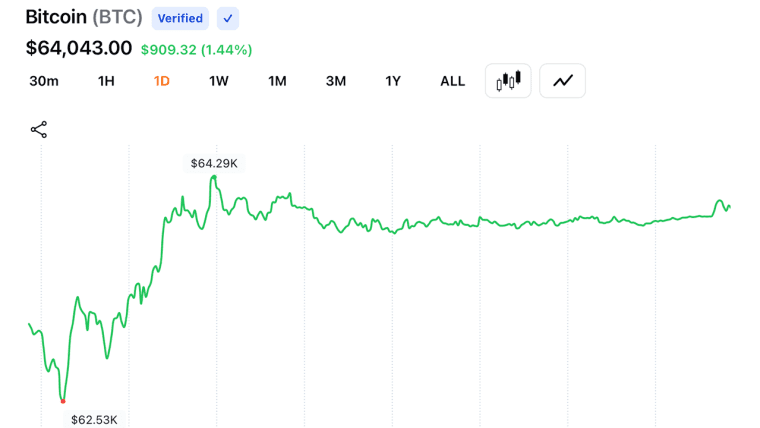
Midway through the market microscope, the 4-hour chart illustrates a fall from grace after an energetic climb from $84,045 to $94,172. Since then, bitcoin has shifted to a lower-highs structure, a not-so-subtle signal that bullish enthusiasm has gone from sizzle to simmer. Price now treads the range between $88,500 and $90,000 with the charisma of a bored cat, refusing to commit in either direction. Volume peaked during the rally and has since thinned out, leaving a vacuum where buyers should be. A breakdown below $88,500 could unleash further downside, likely steering price toward the $86,000 zone.

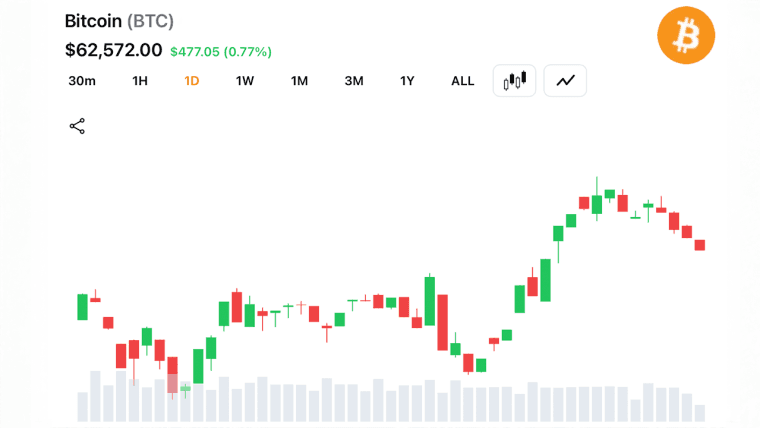
Zooming into the 1-hour chart, we meet bitcoin in full-on sideways shuffle mode—hovering between $88,900 and $90,200 with all the grace of a jittery intern. Lower highs and shallow bounces suggest not accumulation but distribution; in other words, someone’s quietly offloading while retail dreams of a rally. Volume surges tend to favor red candles, another clue that sellers are still setting the tone. The rejection at $90,286 lacked follow-through, and without a convincing reclaim of $90,500 (with strong volume, mind you), any bullish dreams remain just that—dreams.

The oscillators, those moody market mood rings, are sending mixed signals. The relative strength index (RSI) at 43 is neutral, as is the Stochastic at 54 and the commodity channel index (CCI) at 4. The average directional index (ADX) at 35 is likewise lounging in neutral territory, confirming a lack of trend strength. Only the momentum (10) indicator hints at a more bearish sentiment with a reading of -1,894, while the moving average convergence divergence (MACD) level at -2,353 offers a counterpoint with a more constructive outlook.
And now, the grand ensemble of moving averages—spoiler alert: it’s a red carpet of caution. The exponential moving averages (EMAs) across 10, 20, 30, 50, 100, and 200 periods all lean bearish, with the 10-period EMA at $90,158 and the 200-period EMA down at $104,076. Their simple moving average (SMA) cousins agree, save for the 20-period SMA at $89,410, which dares to flirt with the bullish side. But one green candle doesn’t make a trend, darling. Until multiple timeframes align with momentum and volume, this technical tableau remains firmly hesitant.
Bull Verdict:
Should bitcoin reclaim and sustain levels above $95,000 with strong volume and bullish conviction, the current consolidation could morph into a launchpad. The moving average convergence divergence (MACD) already hints at potential upside, and a break past resistance zones might usher in a broader trend reversal. In that case, the bulls may finally get their day in the sun—assuming they bring volume to the party.
Bear Verdict:
With price action stuck in a lower-highs pattern, selling pressure outweighing buying volume, and nearly all key moving averages flashing red, bitcoin risks sliding further into correction territory. The failure to breach $95,000 resistance suggests waning momentum, while support at $88,500 looks increasingly fragile. Unless buyers stage a convincing comeback, the path of least resistance still points downward.
FAQ ❓
- What is bitcoin’s price today?
Bitcoin is trading at prices between $88,990 to $89,473 as of Dec. 7, 2025, at 8:30 a.m. EST. - Is bitcoin trending up or down right now?
Current charts show a bearish-to-neutral trend with weak bullish momentum. - Where is bitcoin’s key support level?
Major support lies between $88,500 and $88,900, with deeper support near $80,500. - What’s the resistance bitcoin needs to break?
The critical resistance zone is $95,000 to $96,000, which has repeatedly held.