Bitcoin traded for $111,979 on Sept. 8, 2025, at 8:30 a.m., as the market showed tentative signs of recovery after a sharp correction. With a total market capitalization of $2.23 trillion and a 24-hour trading volume of $28.57 billion, the digital asset moved within a narrow intraday range of $110,690 to $112,112, suggesting investor caution ahead of potential breakouts.
Bitcoin Price Watch: Bulls Eye Breakout While Bears Guard Resistance
This article was published more than a month ago. Some information may no longer be current.
WRITTEN BY
SHARE

Bitcoin
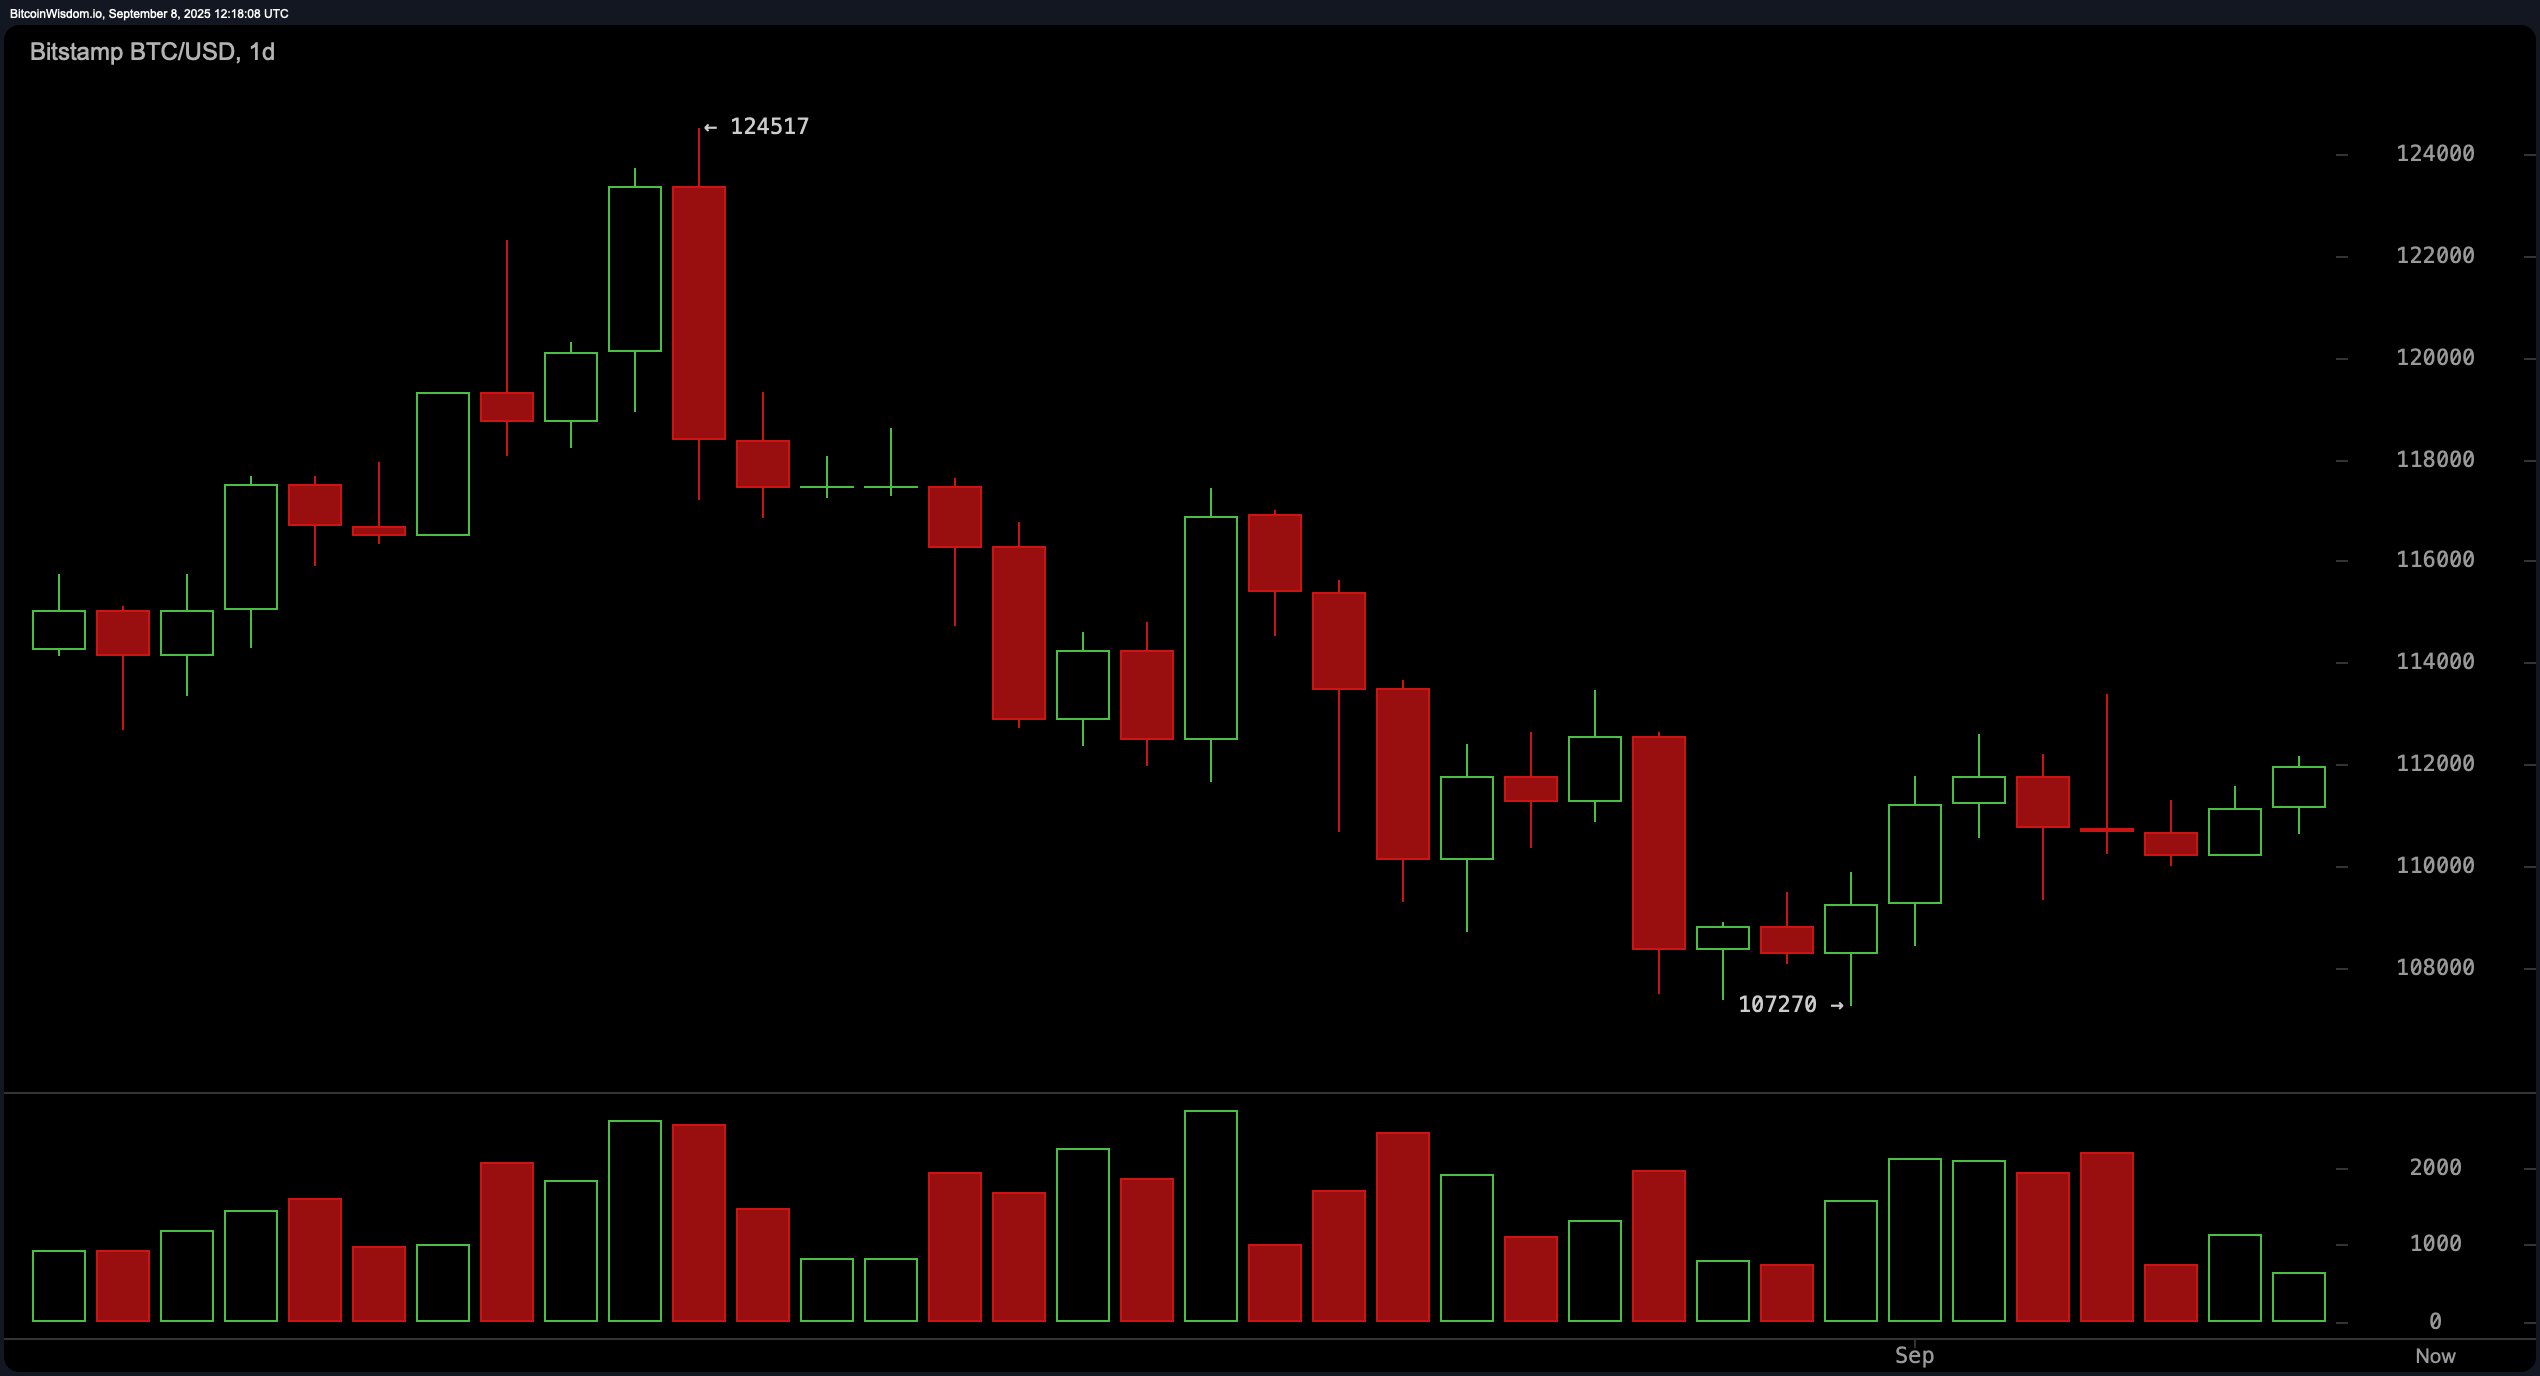
Across all major timeframes—the daily, 4-hour, and 1-hour charts— bitcoin appears to be forming a recovery pattern, albeit under mixed technical signals. The daily chart reflects a bounce from the $107,000 region following a steep 14 percent correction from recent highs near $124,500. Despite this upward movement, price action lacks conviction, with volume waning on green candles, signaling either weak demand or a potential bull trap. Resistance remains firm around the $113,500 to $114,000 zone. A breakout above this level on strong volume would validate bullish momentum, while rejection could usher in renewed downside pressure.
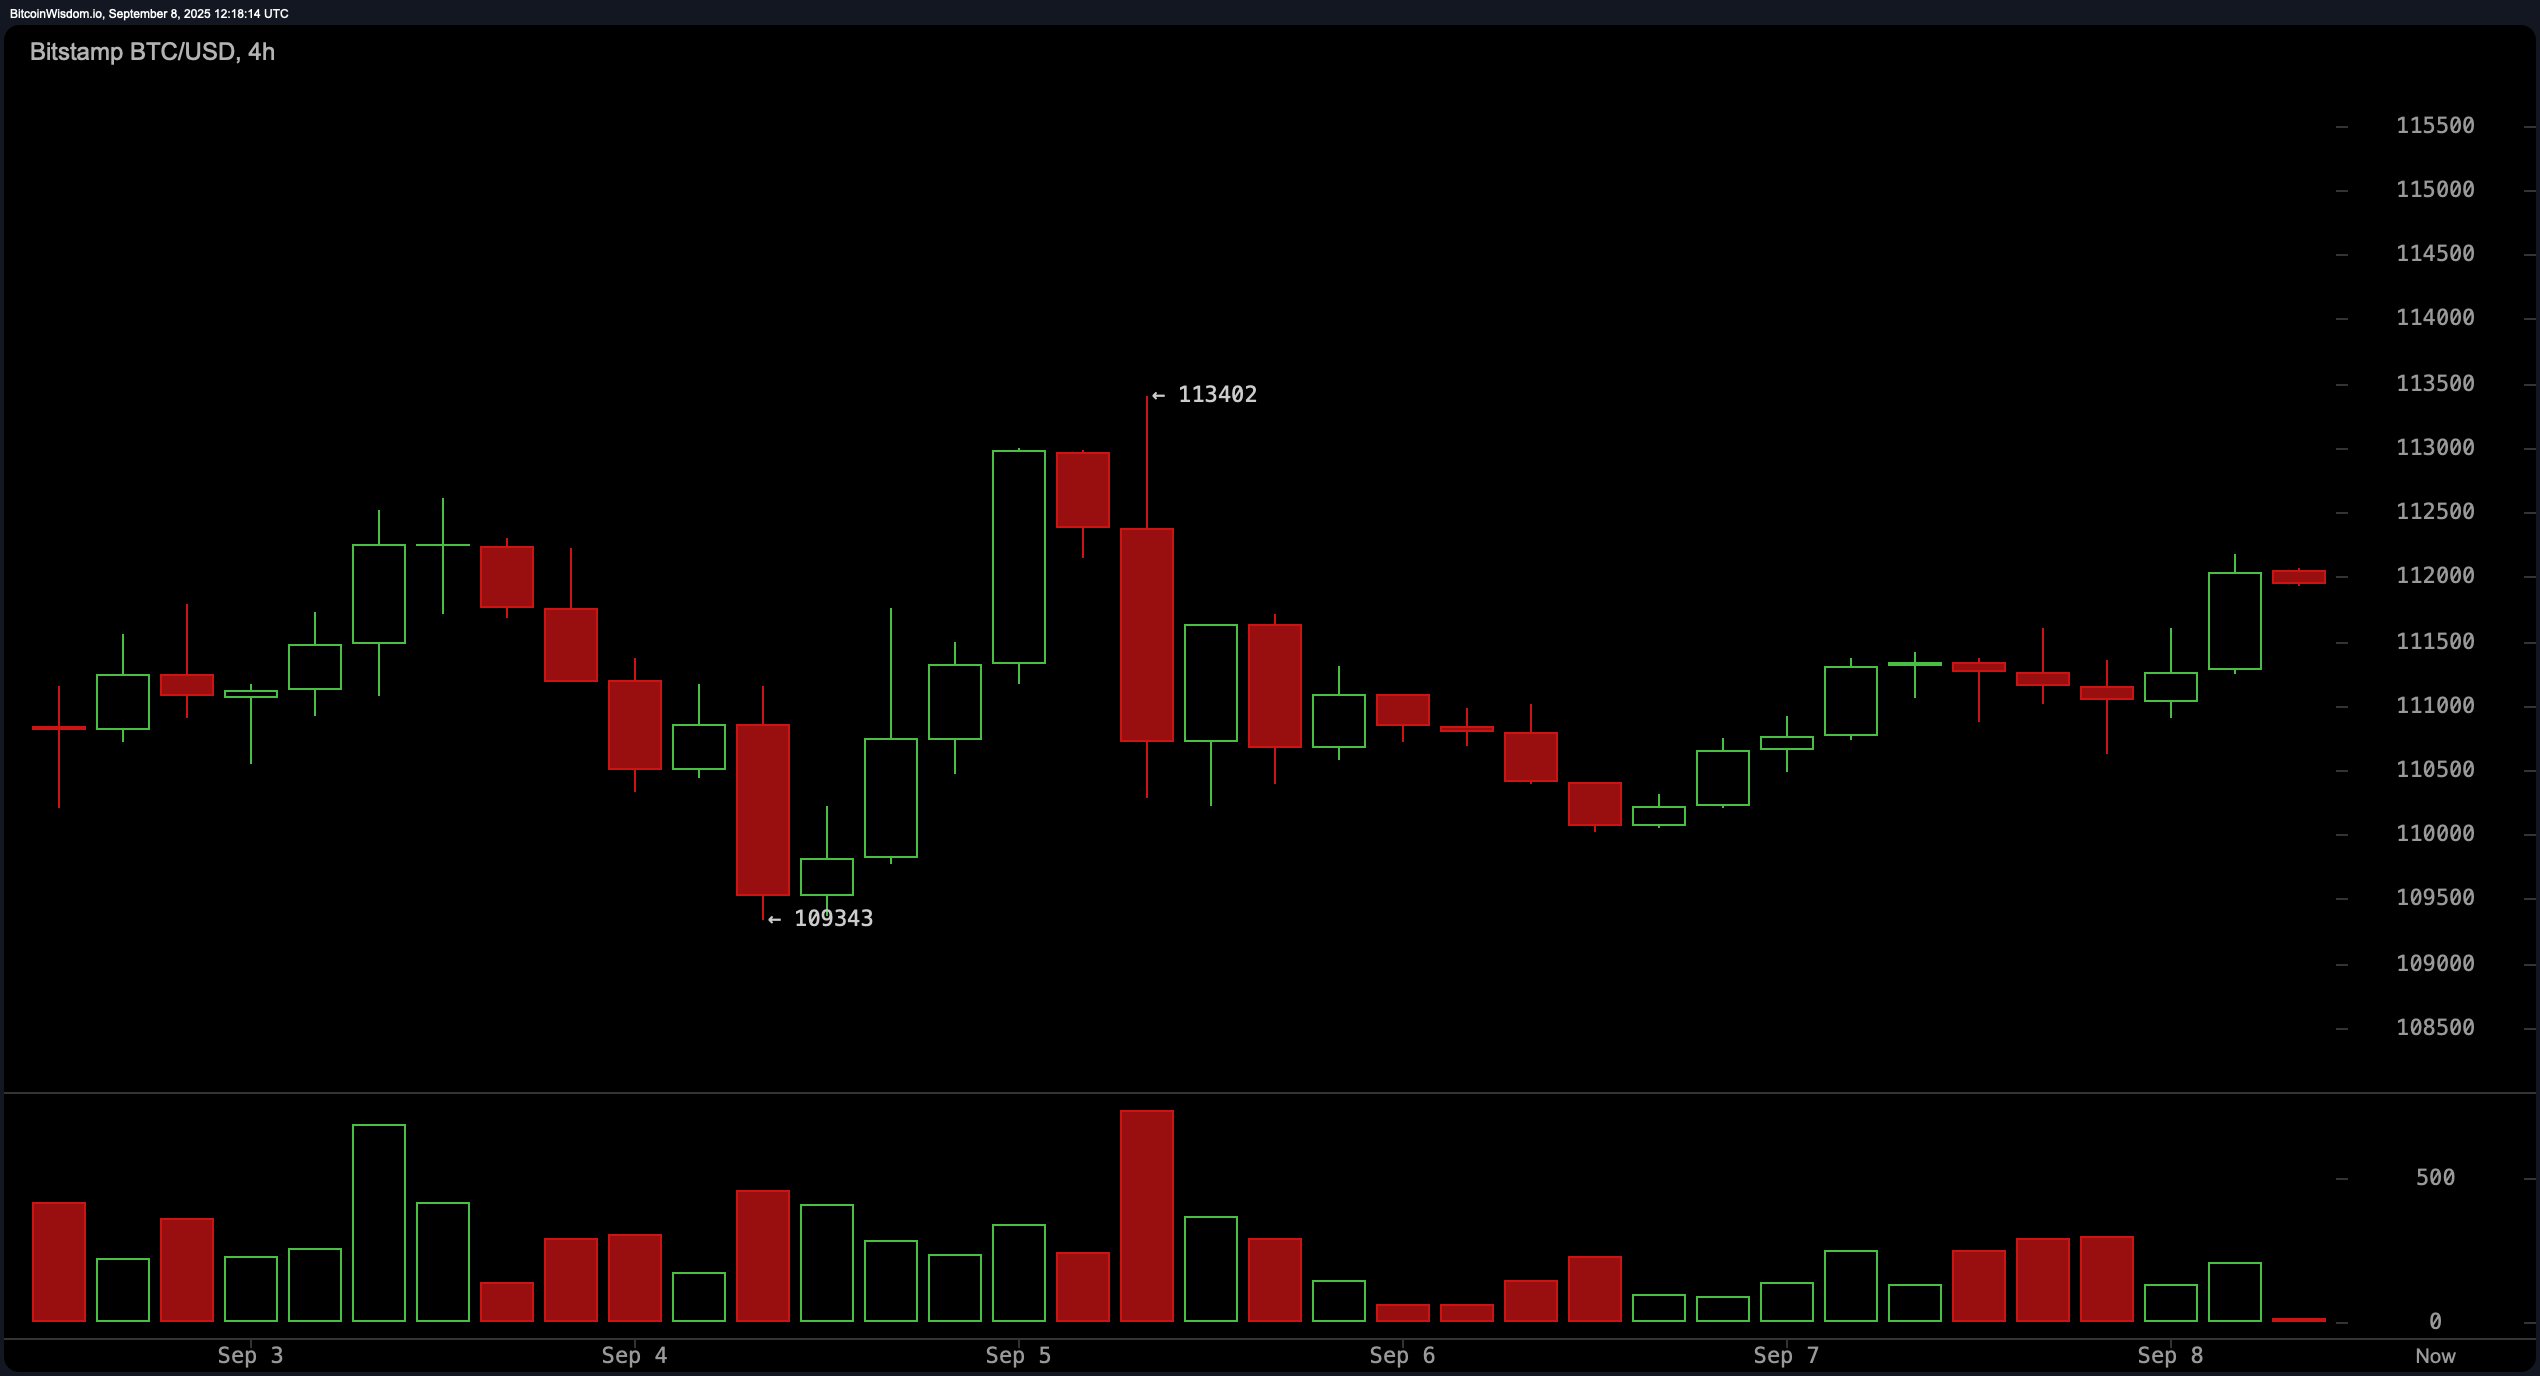
The 4-hour chart suggests moderate bullish bias supported by higher lows, despite a failed breakout attempt at $113,402 earlier in the week. The asset has been consolidating tightly between $109,000 and $112,000 since September 6, pointing to an imminent directional move. Declining volume during consolidation further supports the theory of a breakout setup. For bulls, a clean break and retest above $113,400 with increased volume would signal a continuation toward higher resistance zones. Conversely, a breakdown below $109,300 would invalidate this structure and reinforce bearish sentiment.
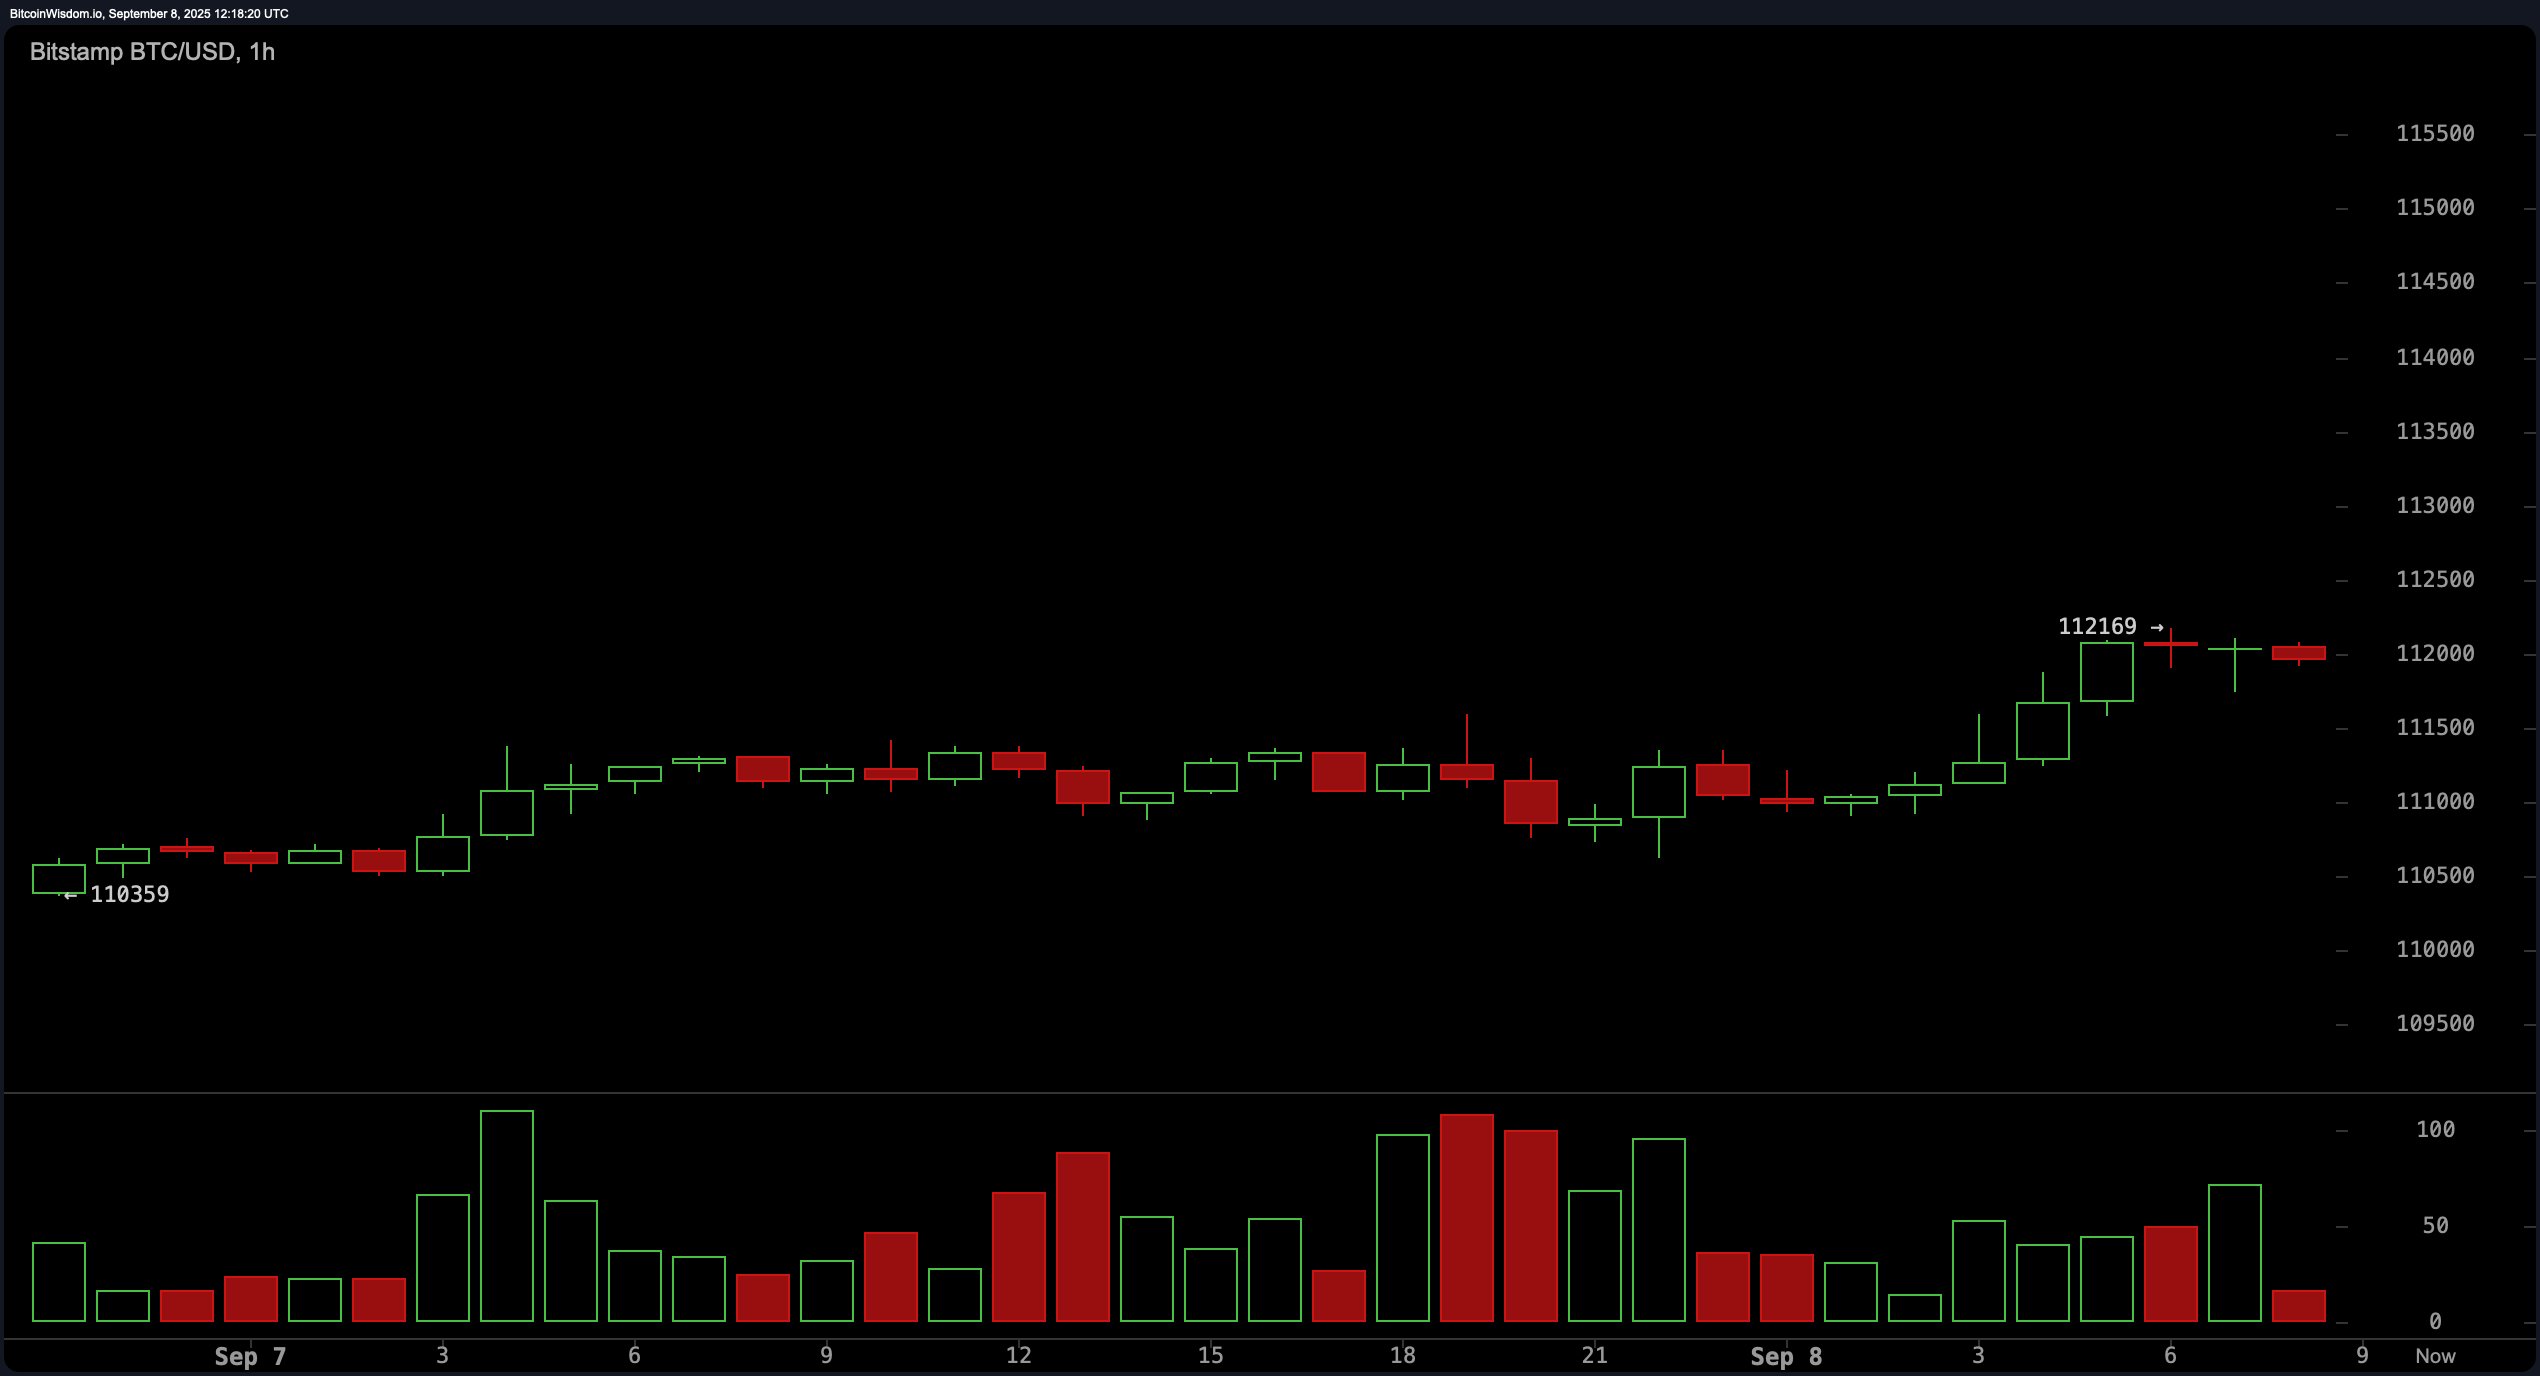
Short-term momentum on the 1-hour chart remains bullish, as bitcoin forms higher highs and higher lows. The price is hovering near $112,000, potentially forming either a bullish flag or a double top pattern. Volume drop-off in this zone suggests buyer exhaustion or hesitation, reinforcing the need for confirmation before entering trades. A breakout above $112,200 on strong volume could open a quick path to $113,400, while a drop below $111,000 would mark a short-term trend reversal, signaling caution for intraday traders.
Oscillator readings across the board reflect market indecision. The relative strength index ( RSI) at 49, stochastic oscillator at 57, commodity channel index (CCI) at 5, average directional index (ADX) at 16, and awesome oscillator at −2,930 are all neutral, providing no definitive direction. However, the momentum indicator at 3,615 and the moving average convergence divergence ( MACD) level at −1,170 both flash buy signals, hinting at latent upward energy in the price action that could manifest if volume picks up.
Moving average data delivers a nuanced picture. Short-term signals are skewing bullish, with both the 10-day and 20-day exponential and simple moving averages showing buy indications. In contrast, the 30-day and 50-day moving averages suggest selling pressure persists on broader horizons. The 100-day exponential moving average supports the bulls, while the 100-day simple moving average tilts bearish. Interestingly, both the 200-day exponential and simple moving averages point to sustained long-term bullishness, reflecting the underlying strength in bitcoin’s macro structure.
In summary, the technical landscape for bitcoin on September 8 remains cautiously optimistic with key resistance looming just above current price levels. Swing traders should await a confirmed close above $114,000 on high volume before entering new positions. Intraday participants can monitor breakout levels at $112,200 and $113,400 for potential scalping opportunities. Tight stop-loss placement remains essential, particularly below $111,000 and $109,300, to manage risk in this volatile environment.
Bull Verdict:
If bitcoin breaks decisively above the $113,400–$114,000 resistance zone on strong volume, the technicals support a bullish continuation toward the $117,000 level. Short-term moving averages and upward momentum indicators suggest latent strength, positioning bitcoin for a potential trend reversal and renewed upside.
Bear Verdict:
Failure to break above the $113,400–$114,000 resistance, coupled with declining volume and neutral oscillator signals, could reinforce a bearish scenario. A drop below key support at $111,000 or $109,300 would confirm bearish momentum, potentially driving bitcoin back toward the $107,000 support or lower.