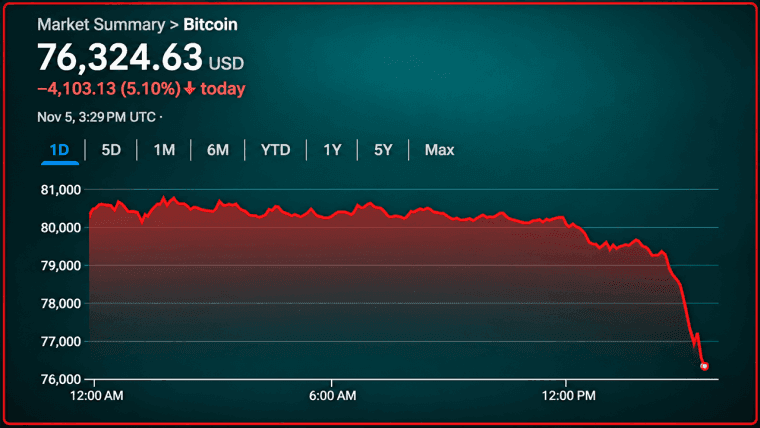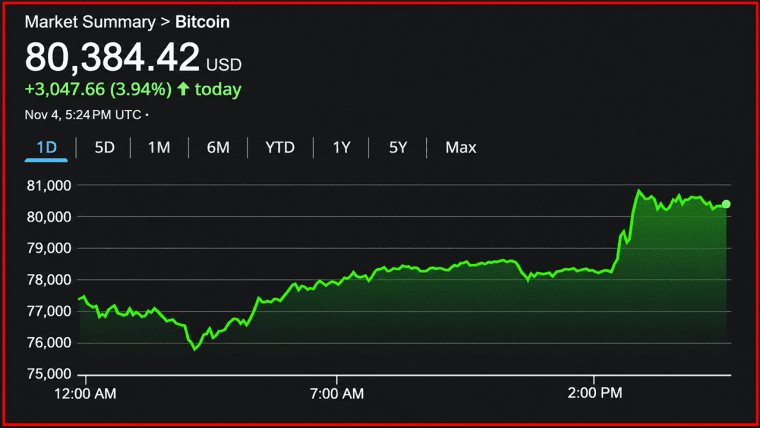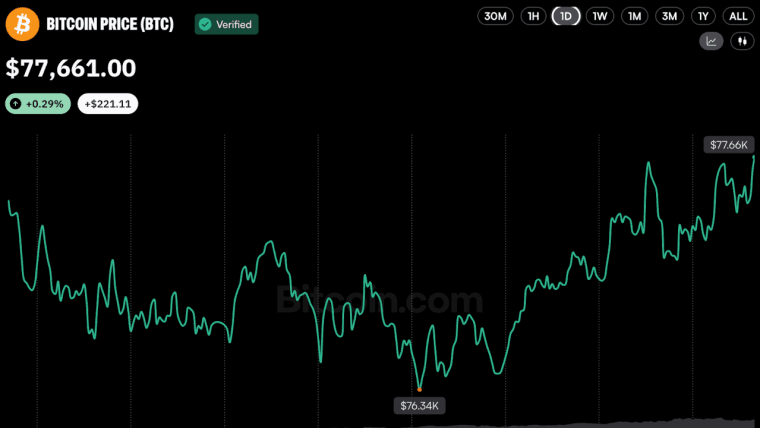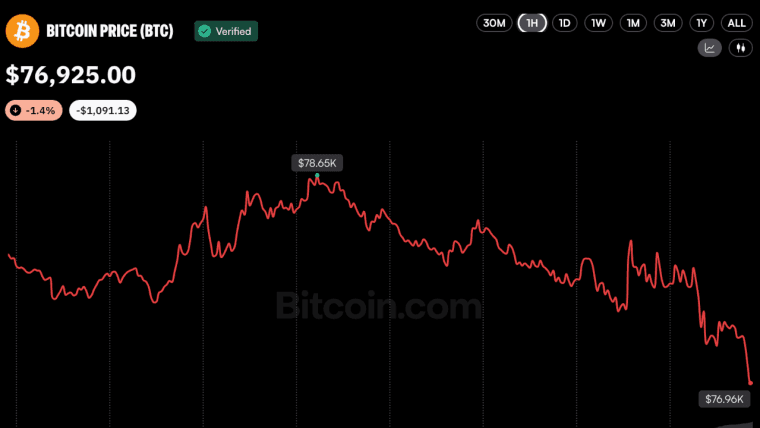



Bitcoin traded at $107,259 with a market capitalization of $2.13 trillion on May 25, 2025. Over the past 24 hours, its trading volume reached $24.98 billion, with an intraday price range between $106,954 and $109,225, reflecting short-term volatility and active market engagement.
Bitcoin Price Watch: Bulls Eye $112K as Market Holds $107K Support

This article was published more than a month ago. Some information may no longer be current.
WRITTEN BY

SHARE

Bitcoin
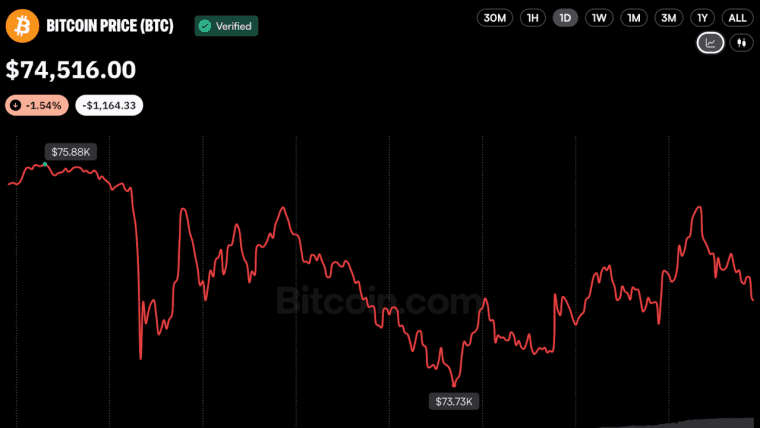
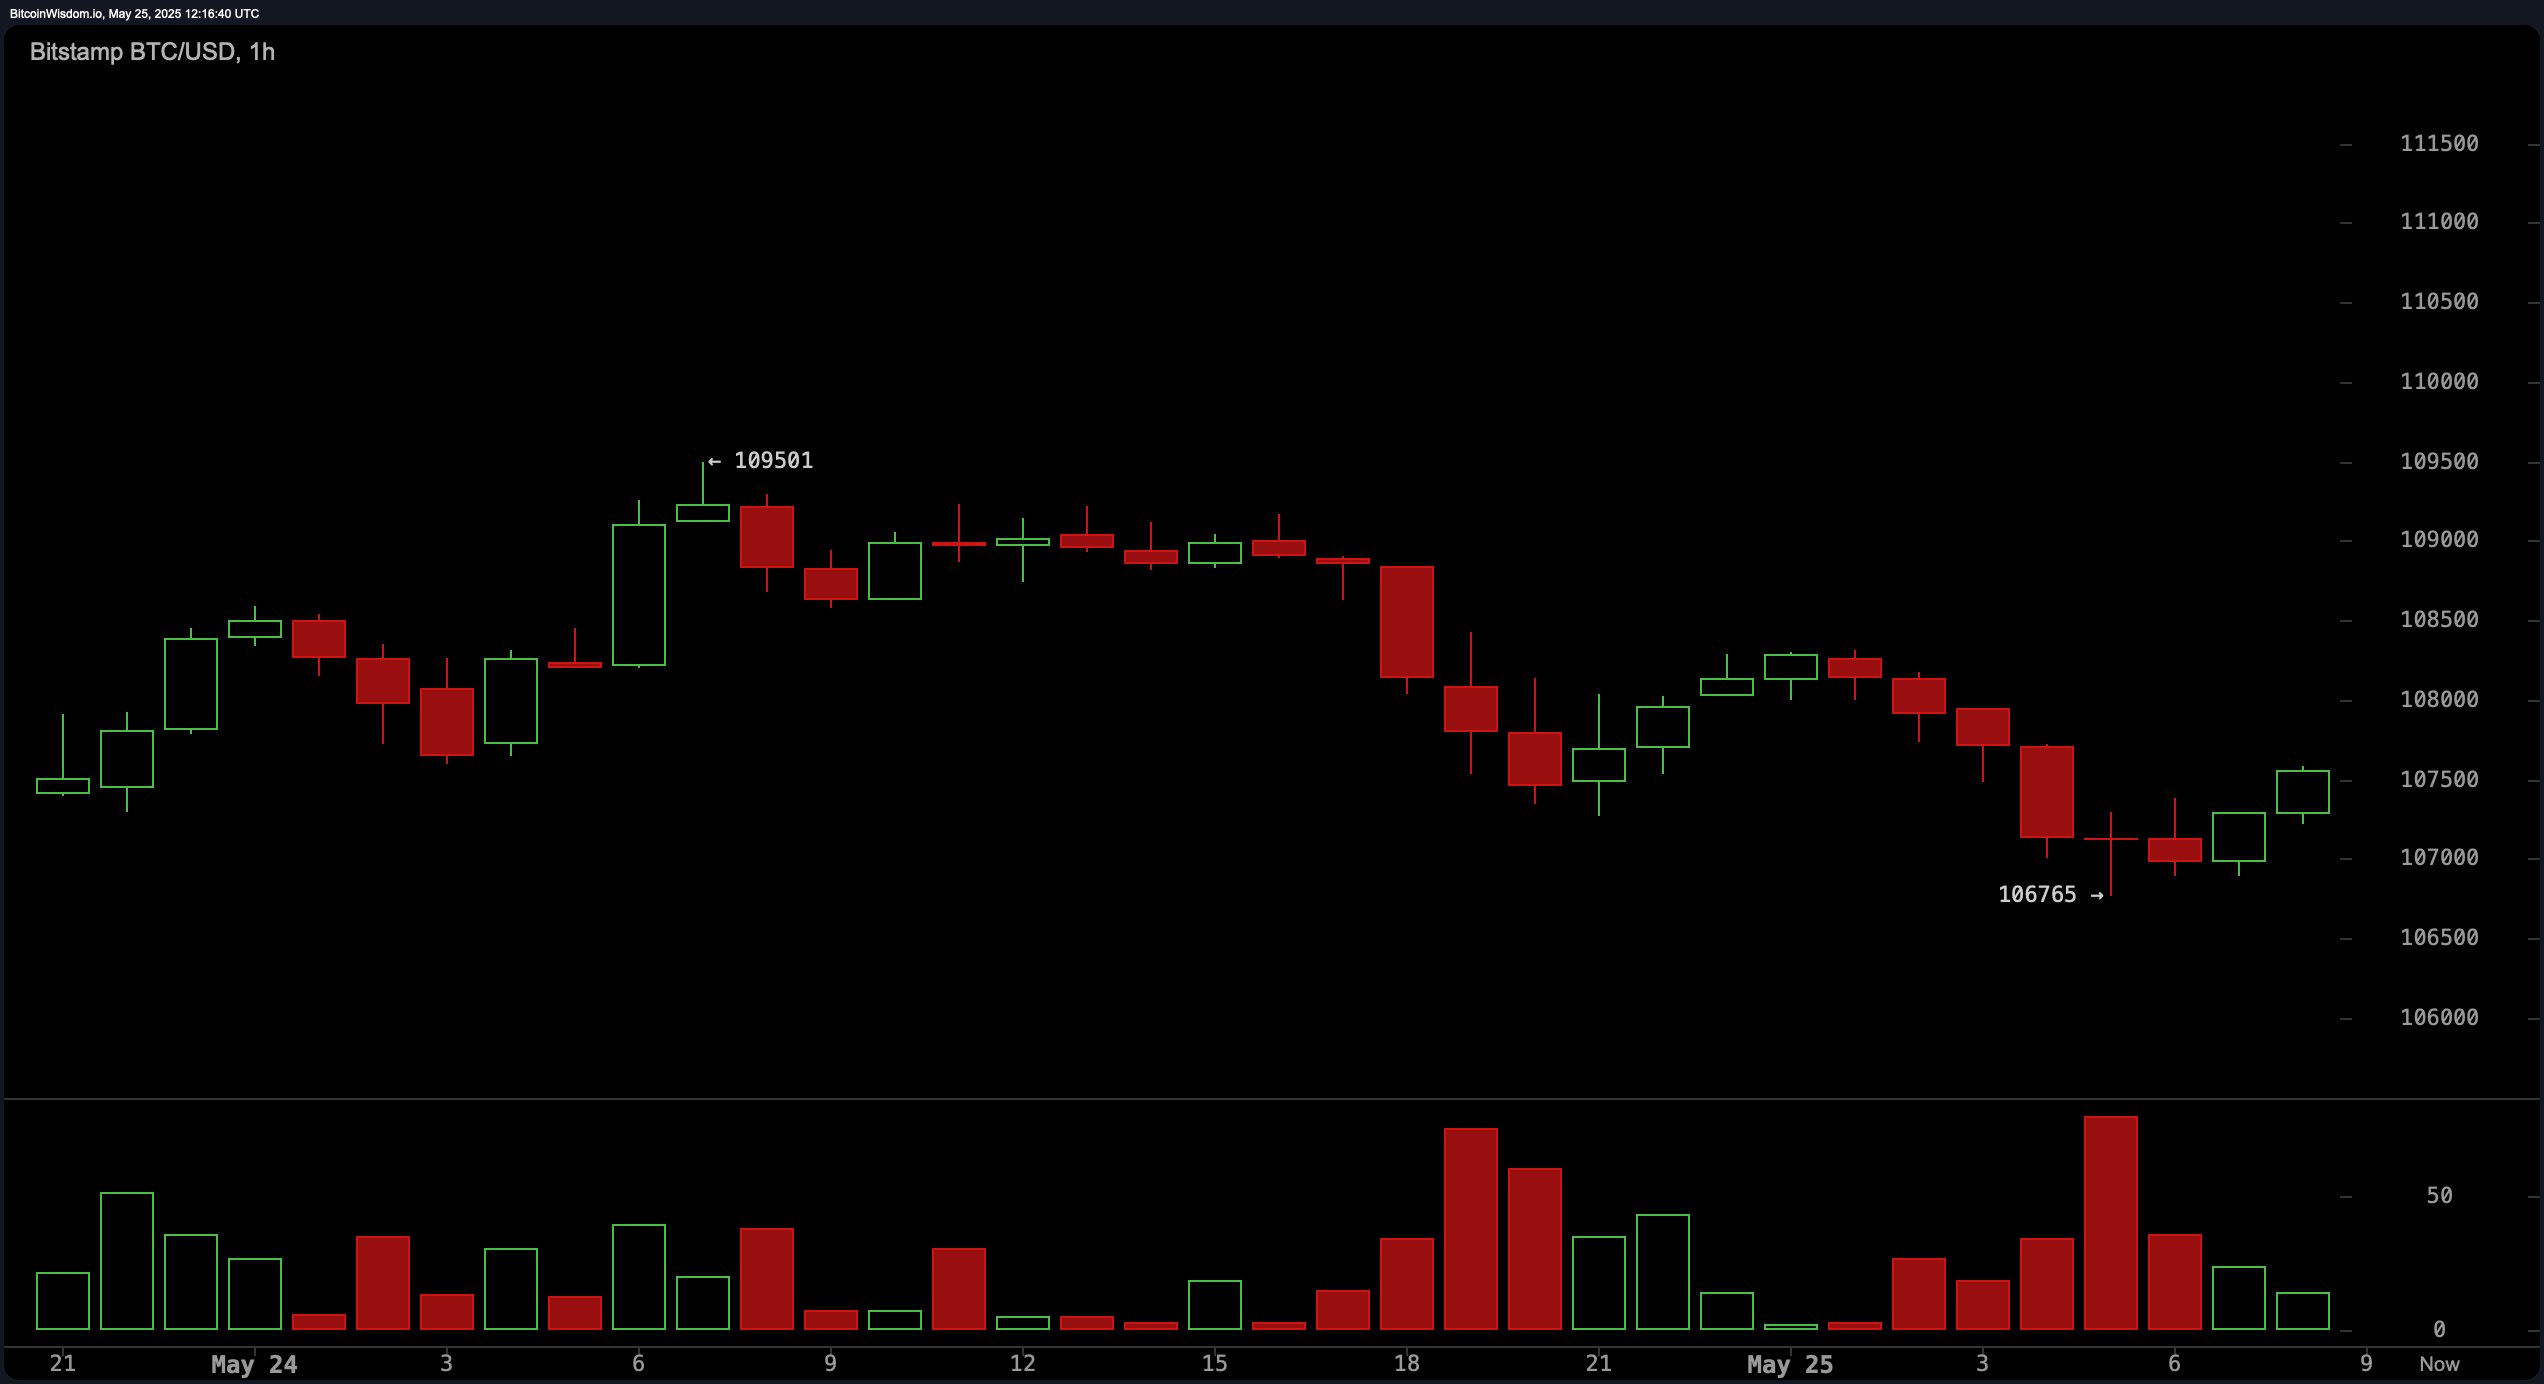
The hourly BTC/USD chart indicates bitcoin is attempting to base after a micro downtrend, stabilizing around $106,765. Recent price action suggests the formation of a potential double bottom or a subtle bullish divergence between price and volume. Volume has been declining on downward moves but has shown a modest uptick accompanying green candles, signaling a potential momentum shift. Scalping opportunities may be present for aggressive intraday traders entering between $107,000 and $107,300, with tight stops below $106,700. More cautious participants may consider entering after a break above $108,000, aiming for a near-term target between $108,800 and $109,500 while trailing stop-losses as price ascends.
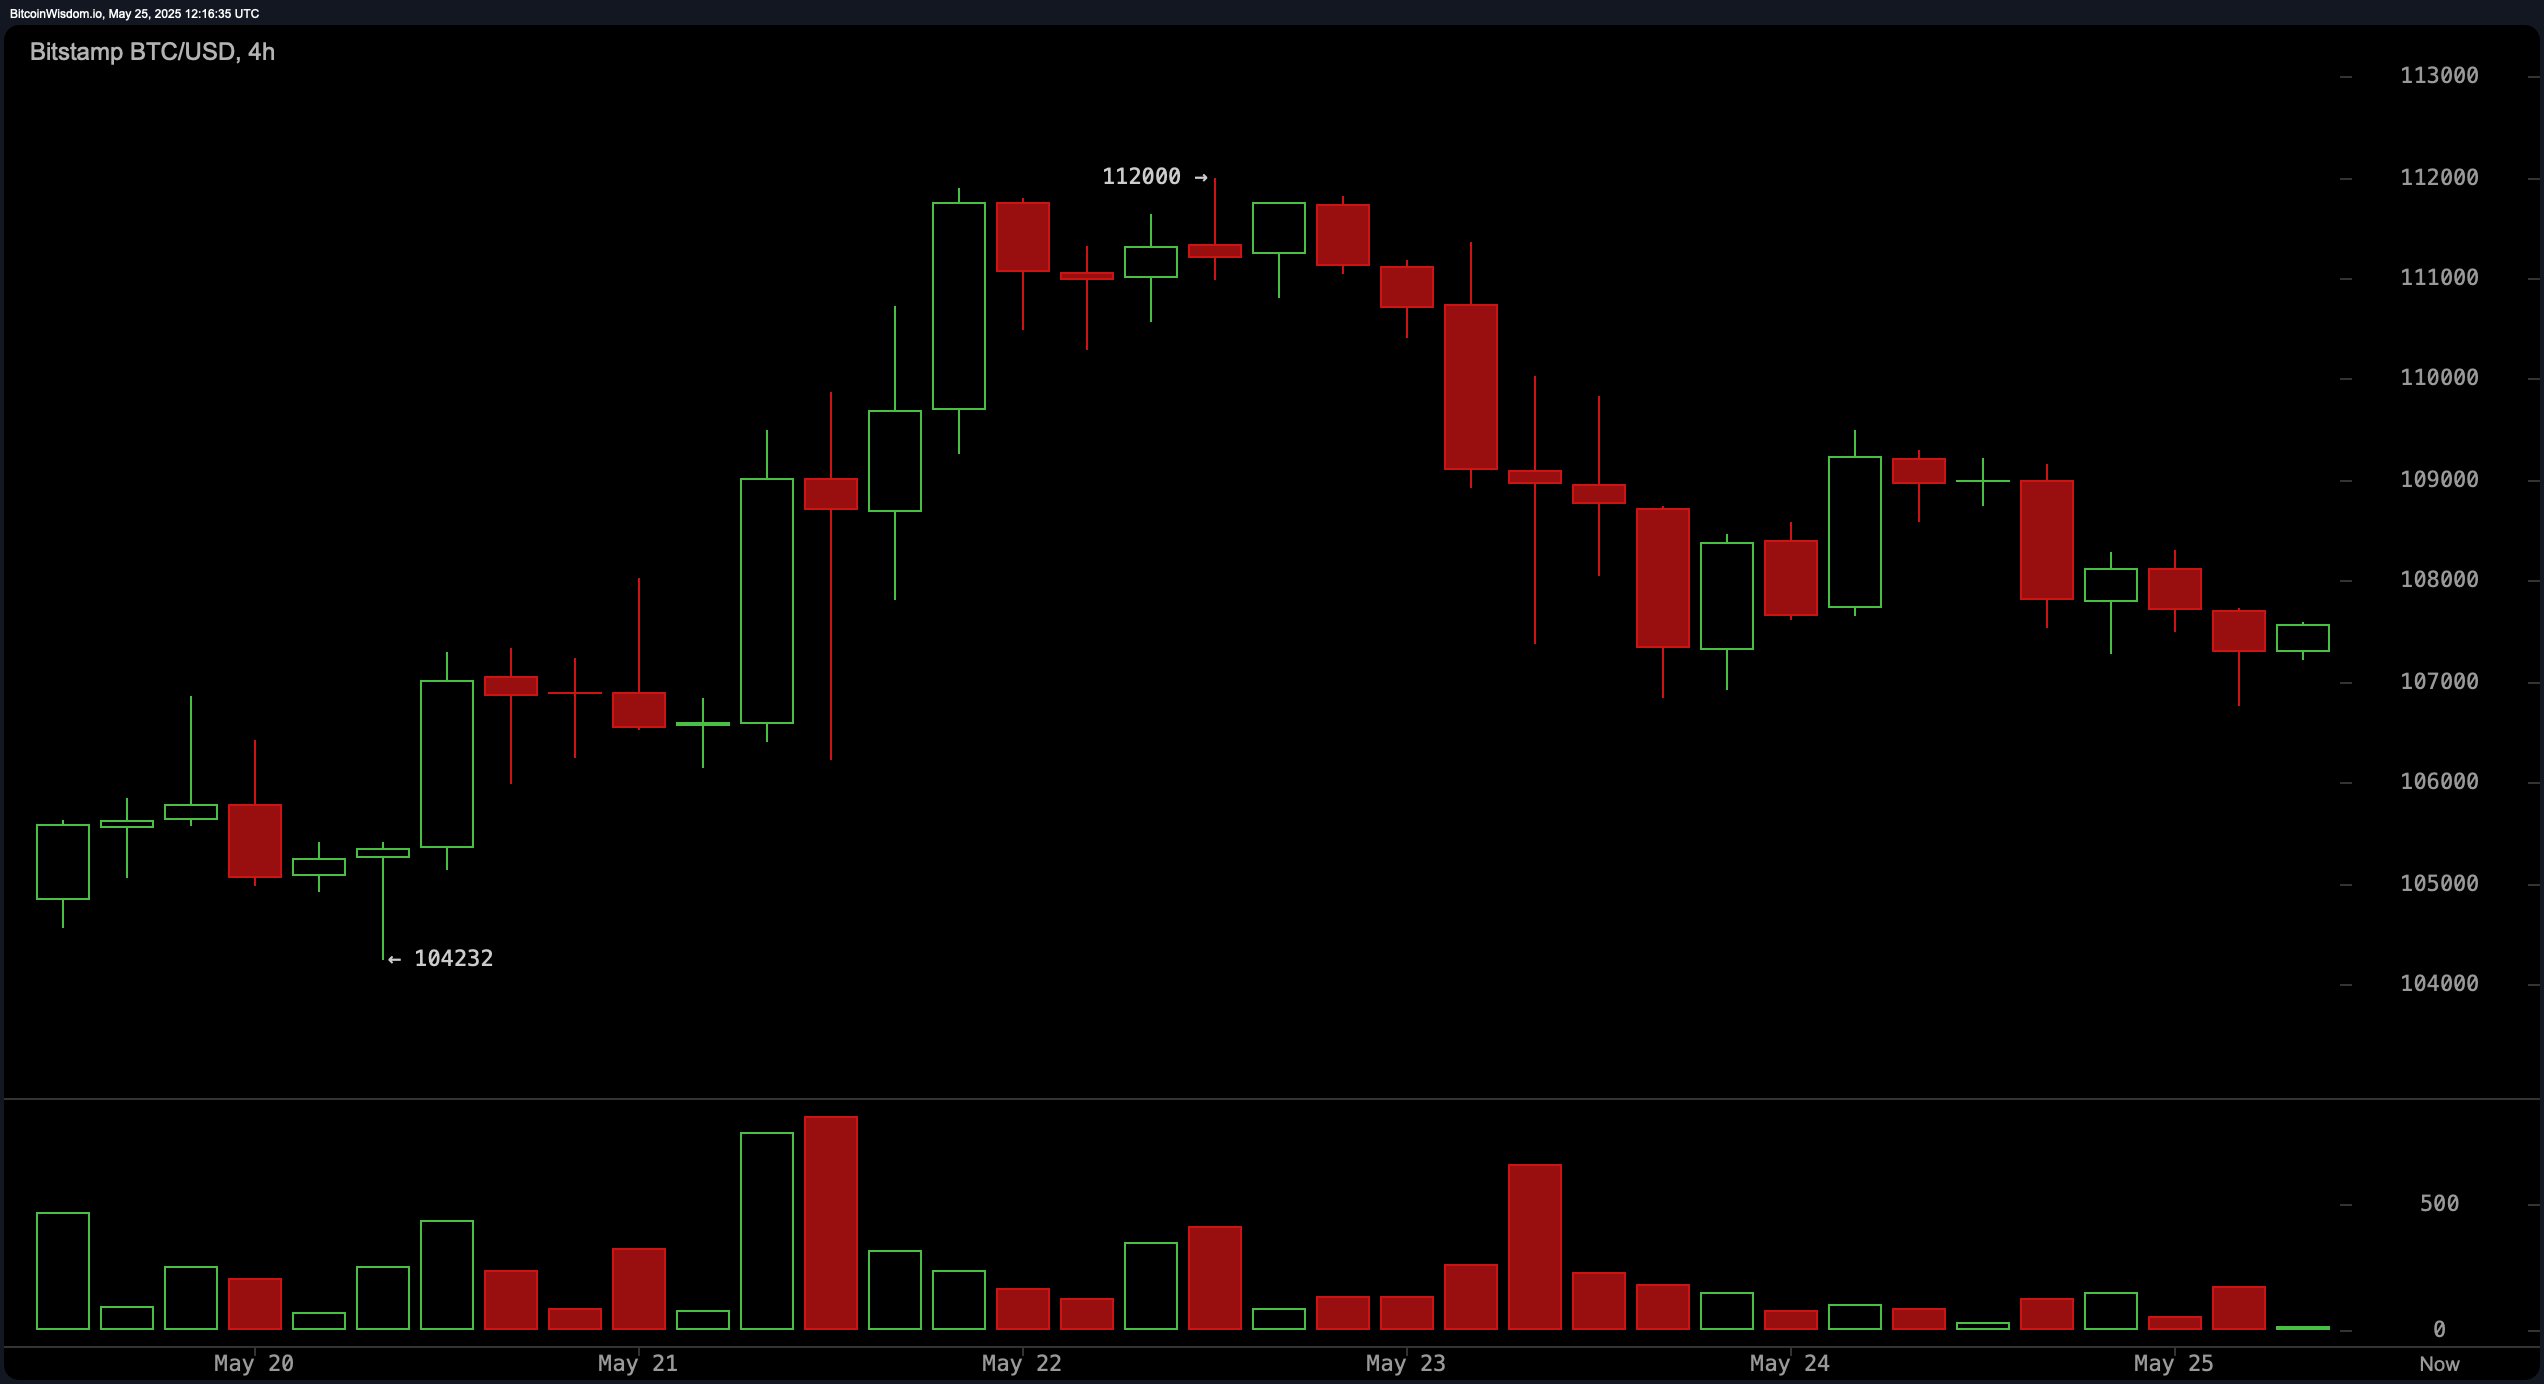
On the 4-hour chart, bitcoin is following a rounded top pattern, initiating a downward structure post the $112,000 peak. A sequence of lower highs and lows has materialized, with bearish volume surging during the drop from $111,000 to $107,000, underlining seller dominance. Short-term traders may identify an opportunity if the price rebounds from the $106,500–$107,000 region with diminishing sell volume. Conversely, a bullish crossover above $108,500 with supporting volume could represent a valid reversal entry point. Potential exits reside within the $109,500 to $110,000 range, but a decisive move above $110,000 is needed to shift the current bias.
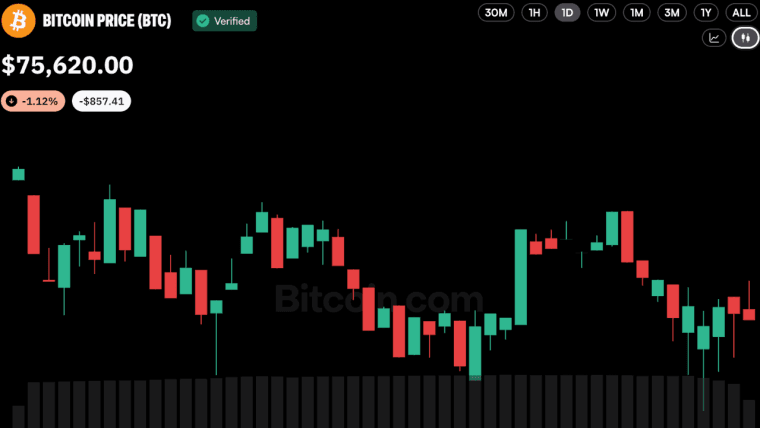
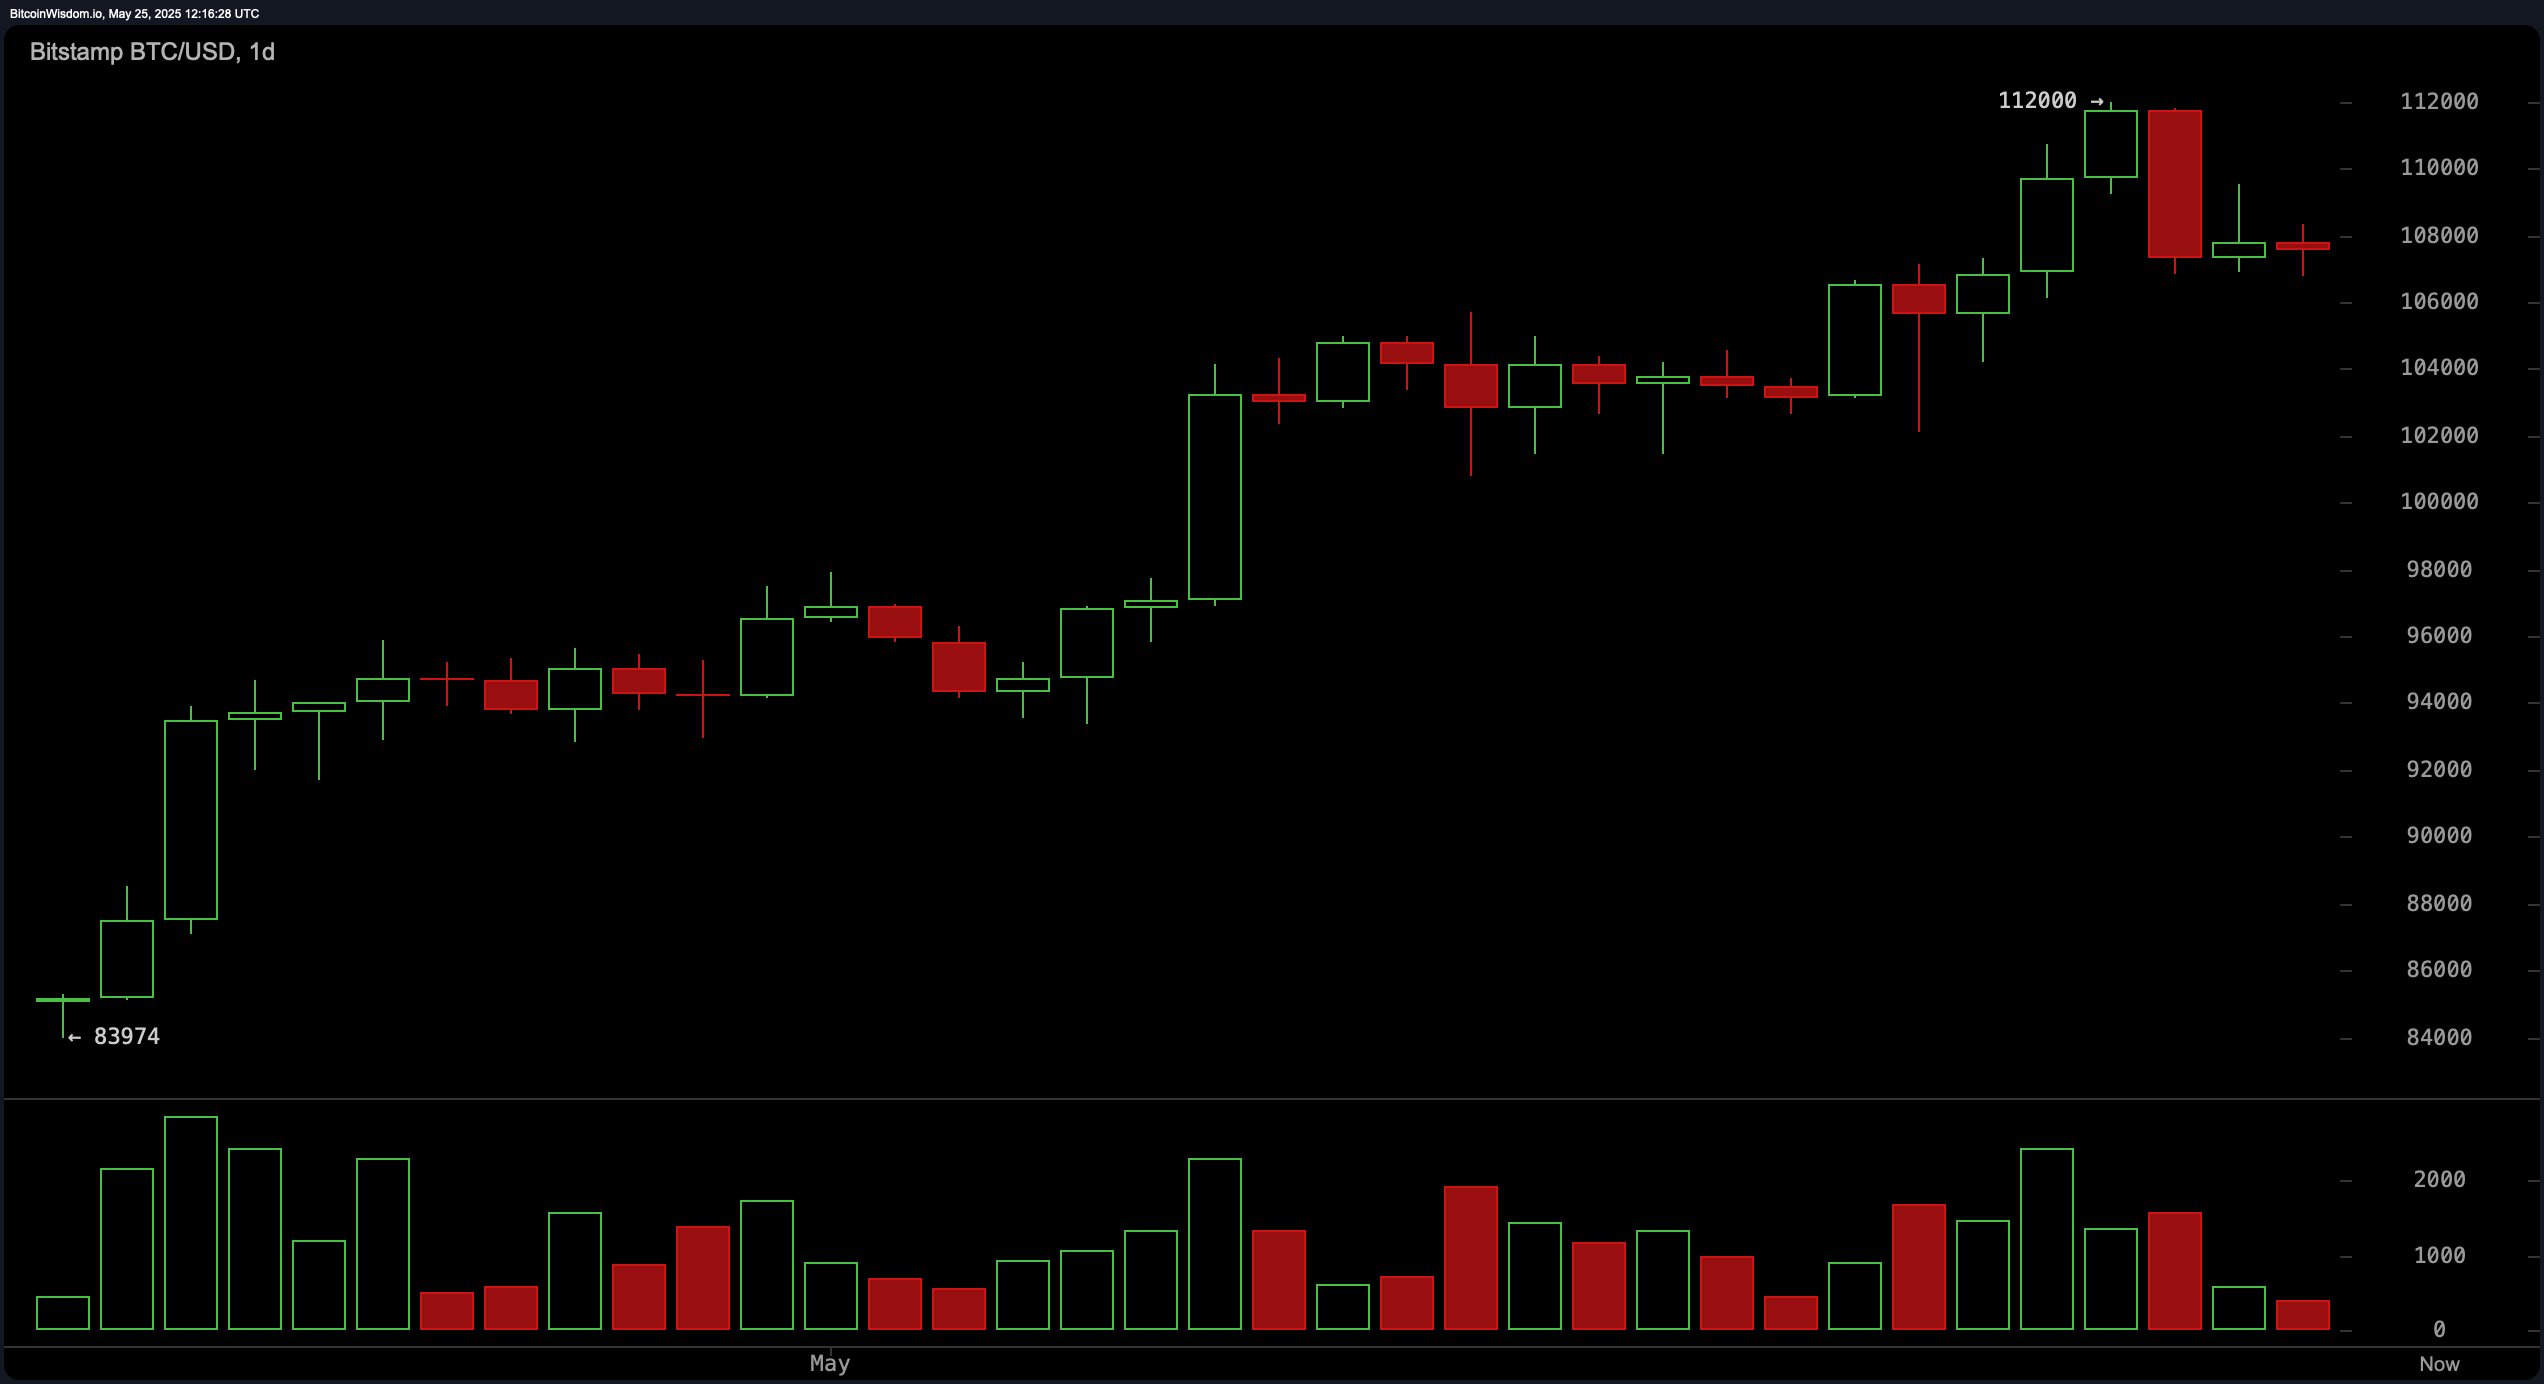
From a daily perspective, bitcoin (BTC) remains in a broader uptrend despite experiencing rejection at the psychological resistance of $112,000. Support lies between $104,000 and $106,000, an area to monitor for stabilization and possible bullish reversal signals. Volume data from this timeframe highlights a surge in selling during the retreat from $112,000, indicative of profit-taking rather than structural weakness. Swing traders should look for strong bullish confirmation near the $106,000 mark before initiating long positions, targeting the $112,000 resistance for profit realization.
Analyzing key oscillators, most indicators portray neutrality with subtle bearish undertones. The relative strength index (RSI) is at 63, signaling a non-committal stance. The Stochastic oscillator and the commodity channel index (CCI) are at 60 and 81, respectively, both indicating neutral momentum. The average directional index (ADX) stands at 33, revealing a lack of dominant trend strength. However, both the momentum indicator at 3,575 and the moving average convergence divergence (MACD) at 3,700 signal sell actions, hinting at short-term bearish pressure that traders should factor into positioning.
Fibonacci retracement levels across all timeframes delineate crucial support and resistance zones. On the daily chart, key levels include 38.2% at $101,294 and 50% at $97,987, both acting as potential accumulation zones in the event of further declines. The 4-hour chart emphasizes support between $107,199 (61.8%) and $108,116 (50%), aligning with intraday bounce zones. Meanwhile, the hourly chart marks critical retracements at $107,810 and $108,133, strengthening the case for near-term support around $107,800, particularly for traders watching for a rebound.
Moving averages (MAs) continue to support a bullish longer-term outlook. All exponential moving averages (EMAs) and simple moving averages (SMAs) from 10-period to 200-period are currently aligned in buy mode. Short-term signals are evident with the 10-period EMA and SMA both above $106,890. Longer-term confidence is reinforced with the 200-period EMA at $89,658 and SMA at $93,966, underscoring broad upward price structure. This layered support suggests that unless significant downside pressure emerges, the overall trend remains constructive, giving investors reasons to remain optimistic.
Bull Verdict:
The alignment of all major moving averages in buy territory, alongside potential double-bottom formation on the hourly chart, favors a bullish continuation. If bitcoin holds above $107,000 and reclaims the $108,500 level with volume confirmation, a renewed attempt at $112,000 appears viable. Longer-term trend structures remain intact, supporting upward momentum barring any macroeconomic shocks.
Bear Verdict:
Despite the upward trajectory on broader timeframes, recent price rejection at $112,000 and sell signals from the momentum indicator and moving average convergence divergence (MACD) suggest caution. Failure to hold support near $107,000 or a break below $106,700 could accelerate a move toward deeper retracement levels at $104,000 and $101,294, exposing bitcoin to further correction.
Final Take:
Bitcoin is at a technical crossroads, with bullish structure still valid but facing short-term headwinds. Traders should stay adaptive—favoring long setups above $108,500 and preparing for deeper support testing if $106,700 fails. Confirmation through volume and price action is essential before committing to directional trades. Risk management remains paramount in this volatile phase.
About the author
WRITTEN BYJamie RedmanNews Lead
Jamie Redman is the News Lead at Bitcoin.com News and a financial technology journalist based in Massachusetts.