Bitcoin hovered at $109,319 as of June 11, 2025, showing resilience amid a cooling phase. The cryptocurrency posted a market capitalization of $2.17 trillion and a 24-hour trading volume of $32.03 billion, with price action ranging from $108,633 to $110,237.
Bitcoin Price Watch: Bullish Structure Holds, But Buyers Show Signs of Fatigue
This article was published more than a month ago. Some information may no longer be current.
WRITTEN BY
SHARE

Bitcoin
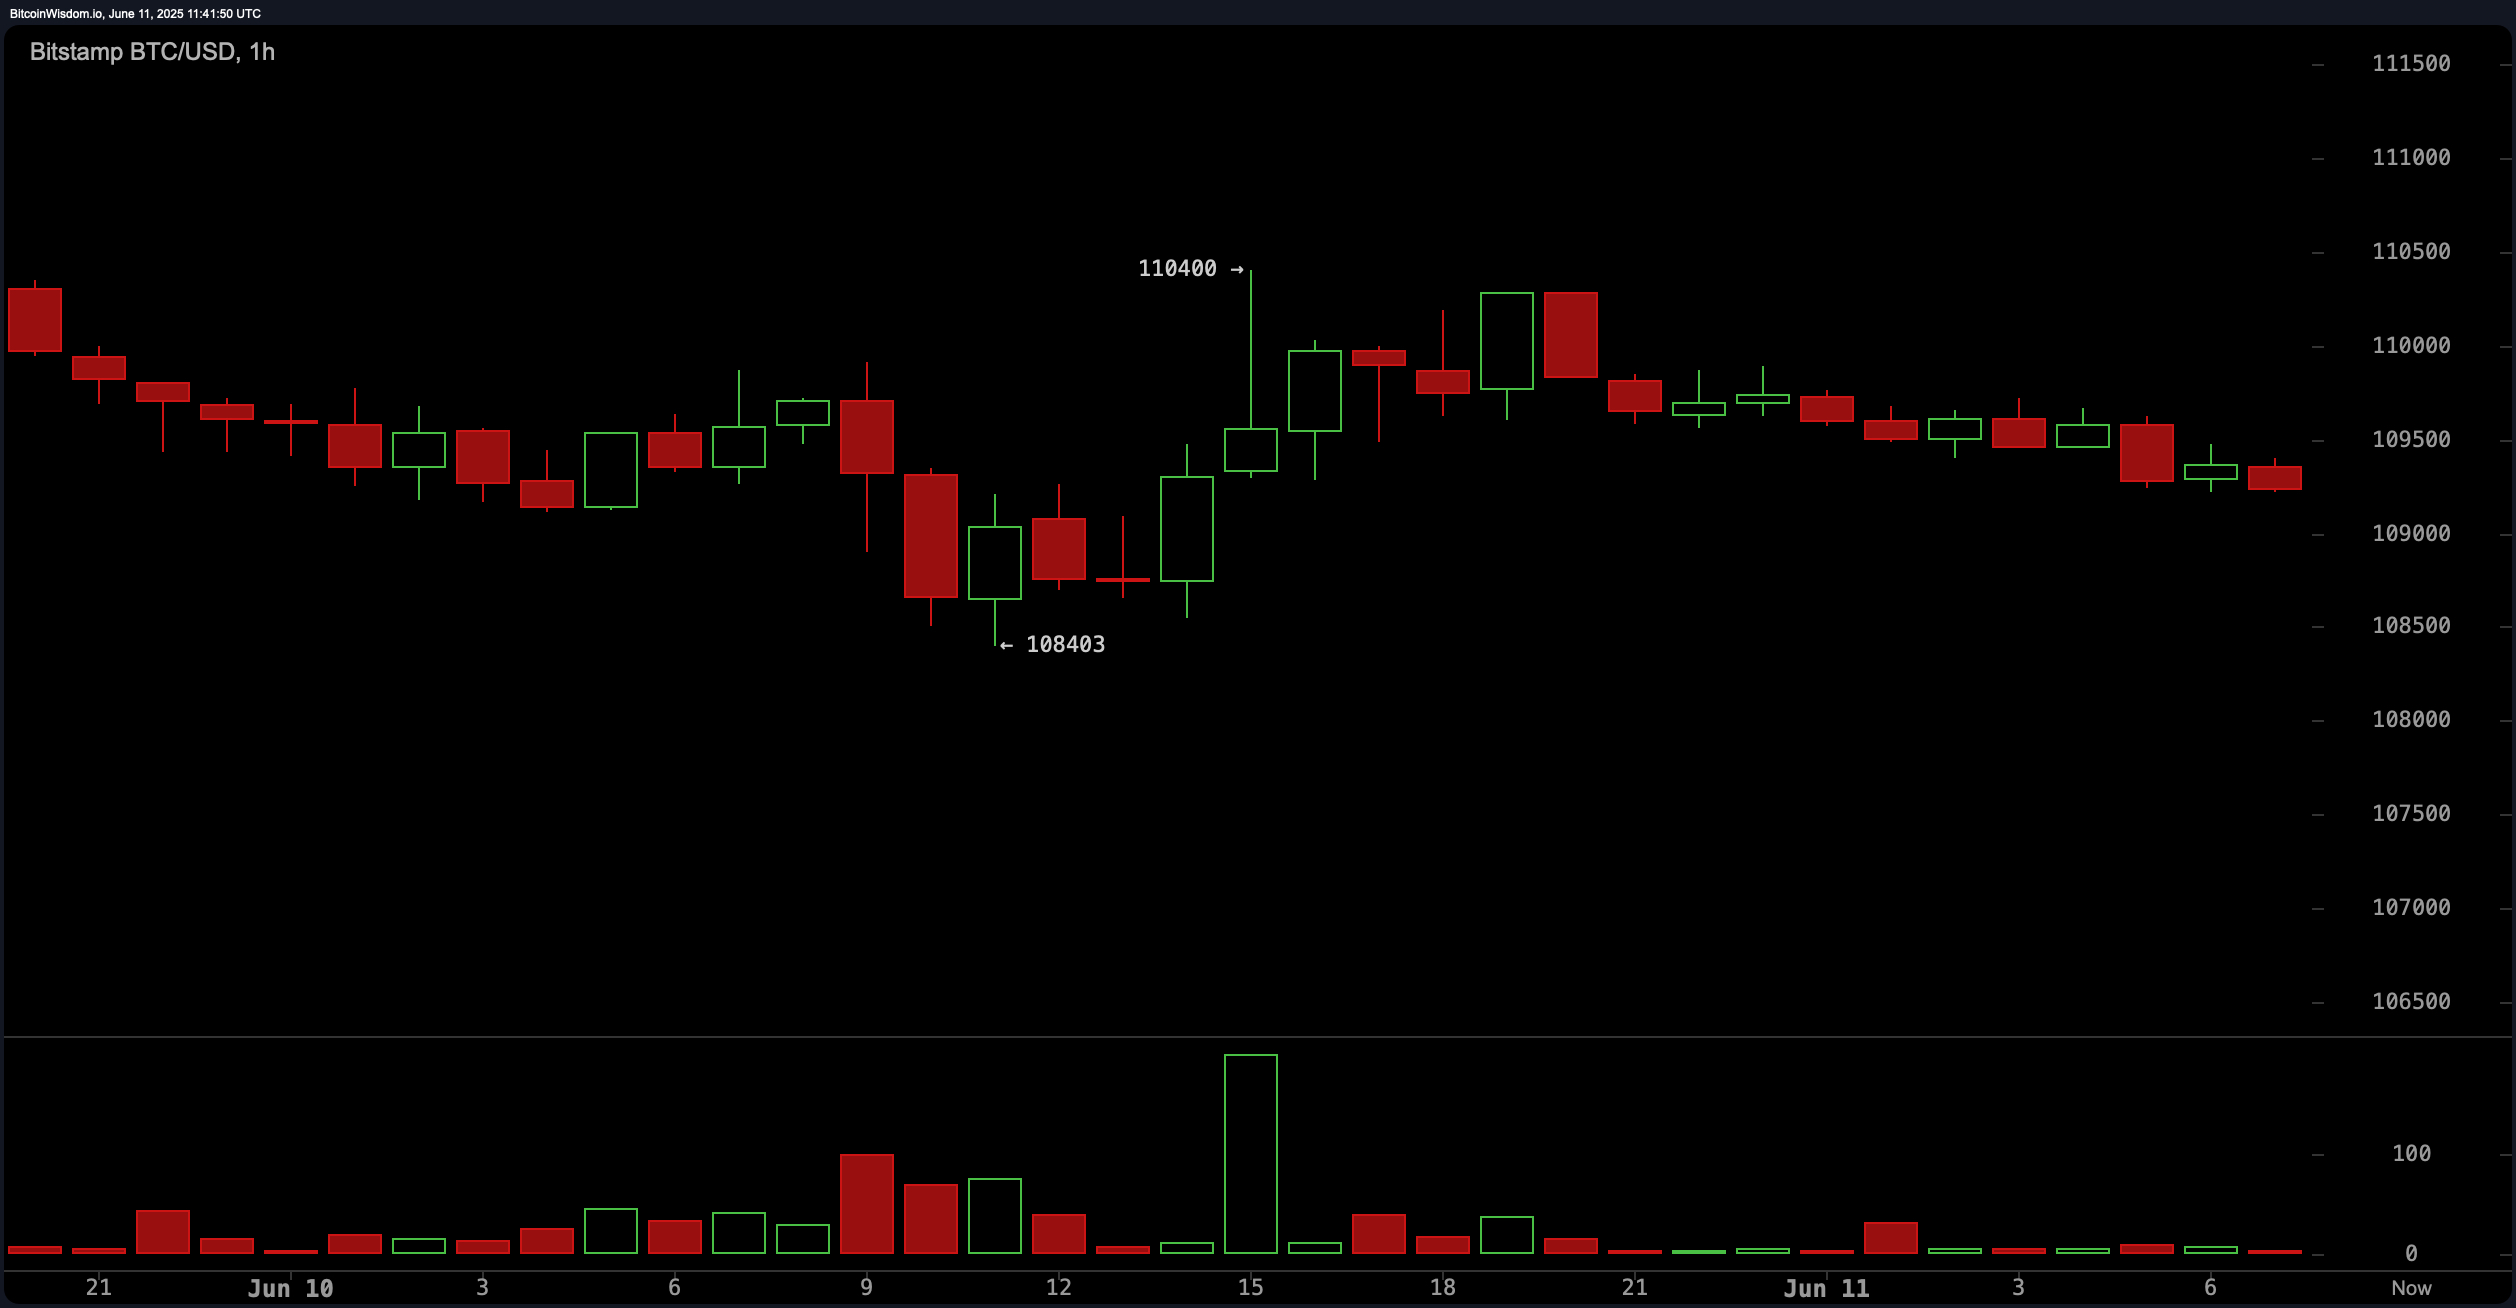
On the 1-hour chart, bitcoin displays short-term indecision following a quick rejection from $110,400, which created a localized top. The price has since flattened around the $109,500 mark, with markedly low volume suggesting reduced conviction among traders. Entry opportunities are contingent on a breakout above $110,400 or a breakdown below $108,500. Given the muted momentum, only quick trades with narrow profit targets—typically within a 100–200 point range—are advisable at this timeframe.
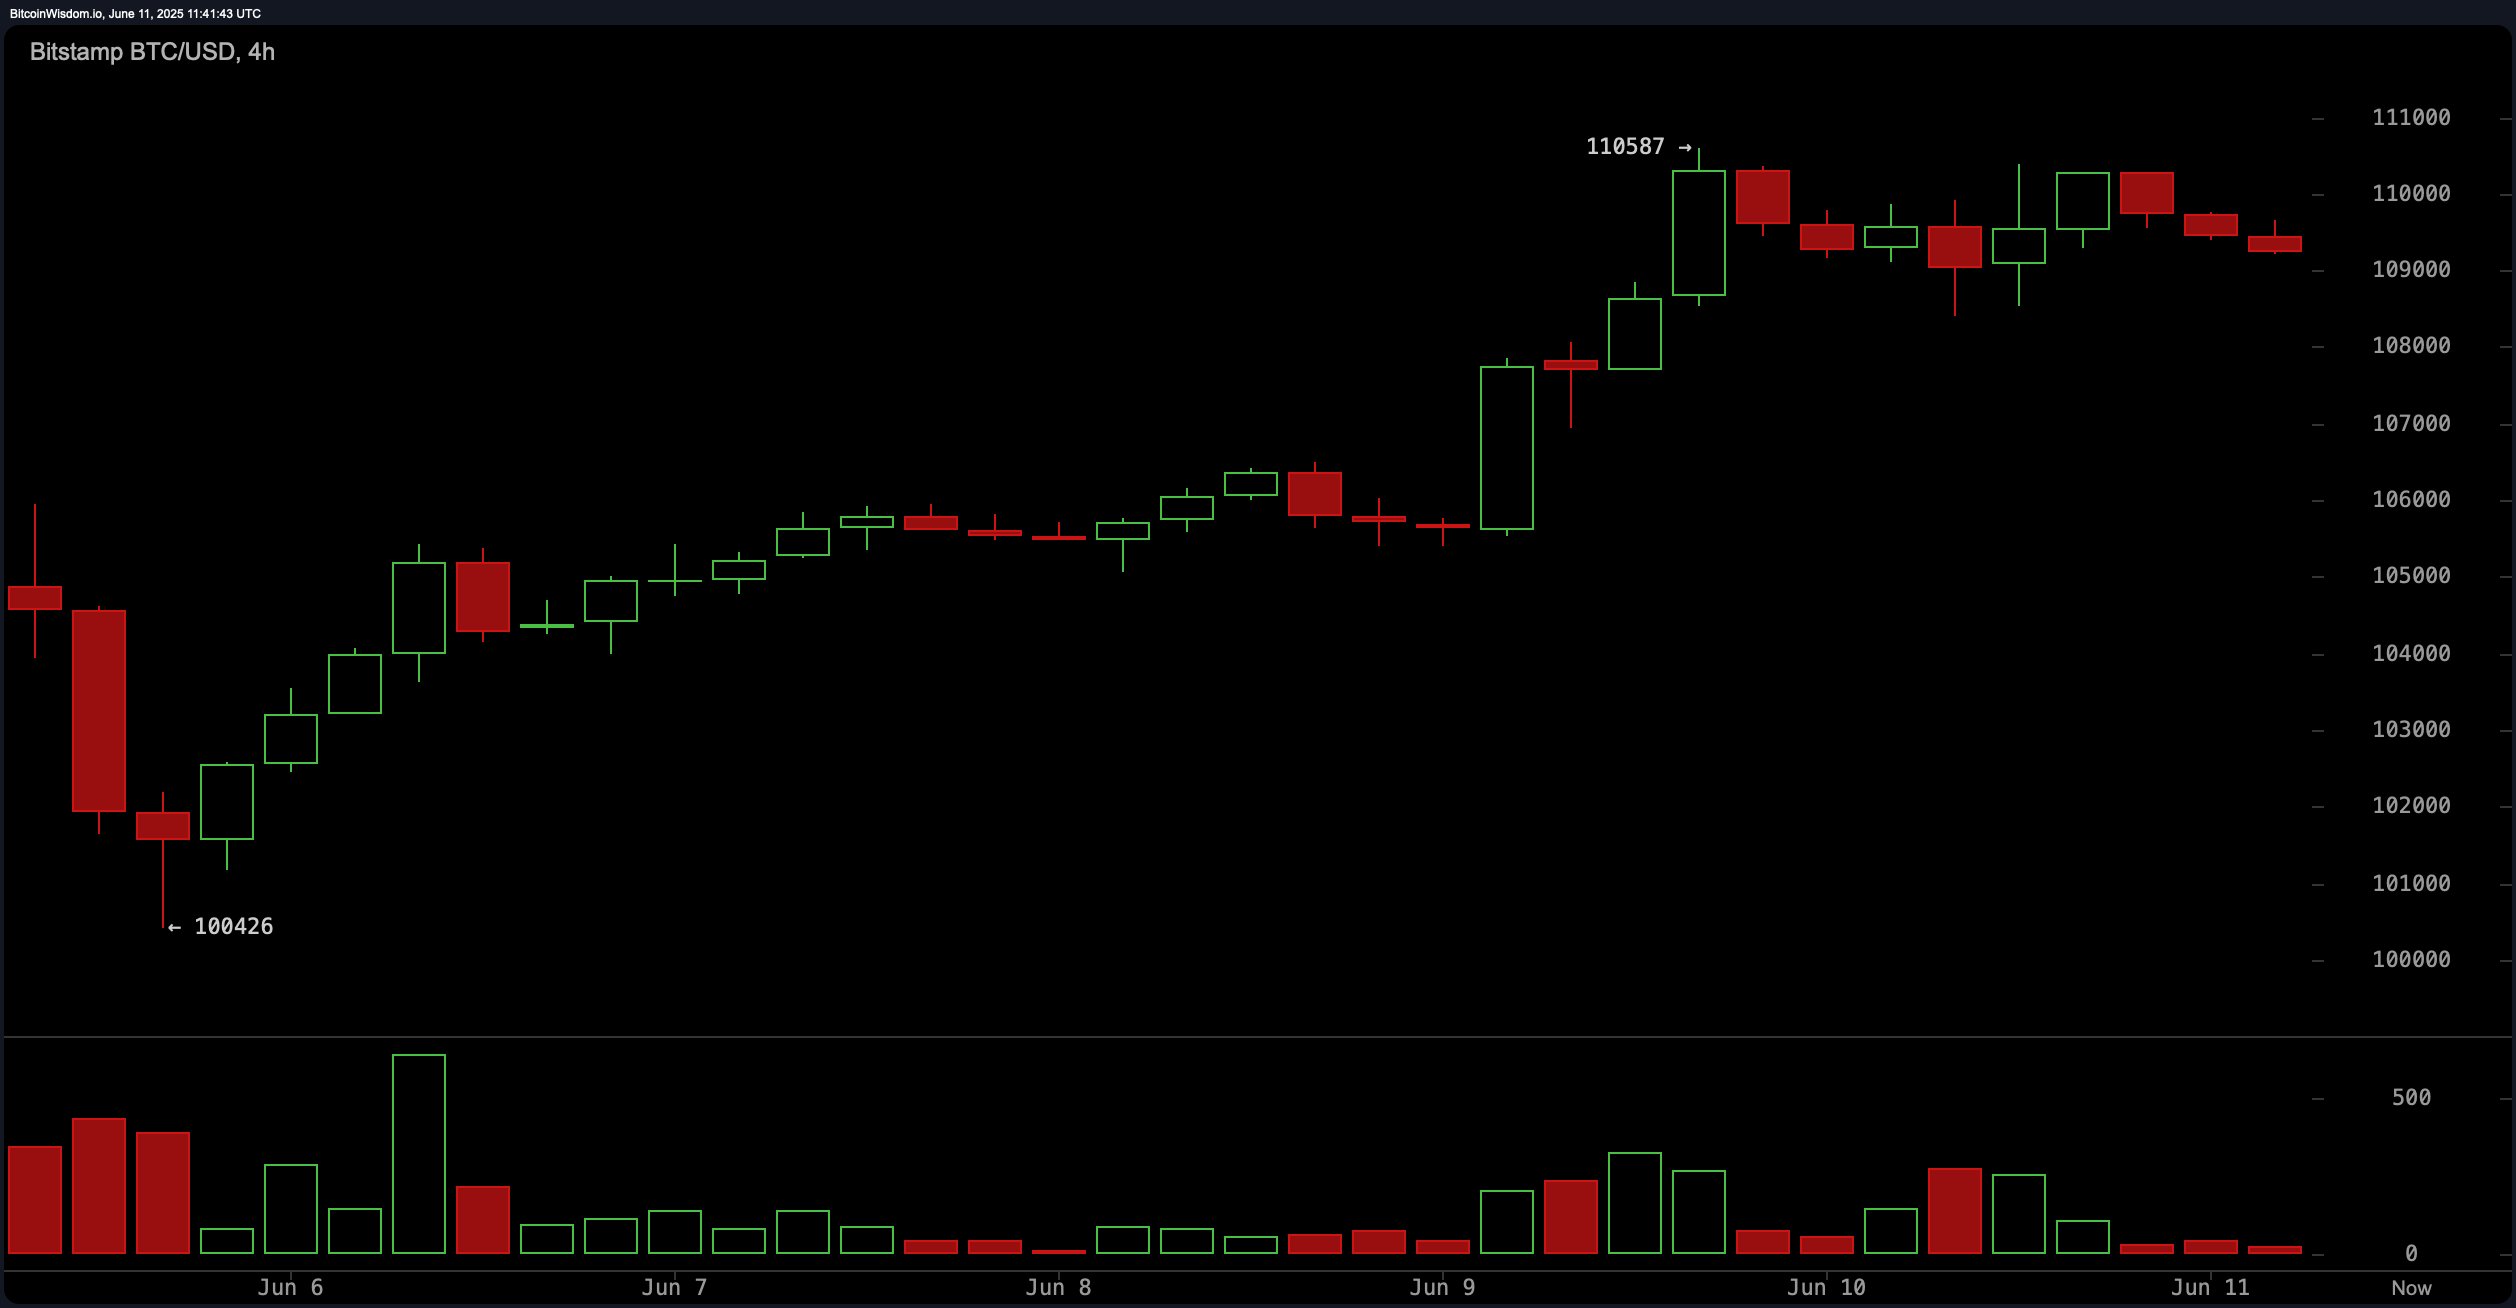
The 4-hour bitcoin chart reveals a recent V-shaped recovery from $100,426 to $110,587, succeeded by sideways consolidation. This pattern resembles either a bullish flag or an early distribution phase. A decisive breakout above $110,600 on increasing volume may initiate another leg higher, while a breakdown below $109,000 could trigger a retracement. Traders may consider aggressive entries on strength or accumulate near $108,000 if supported by signs of demand.
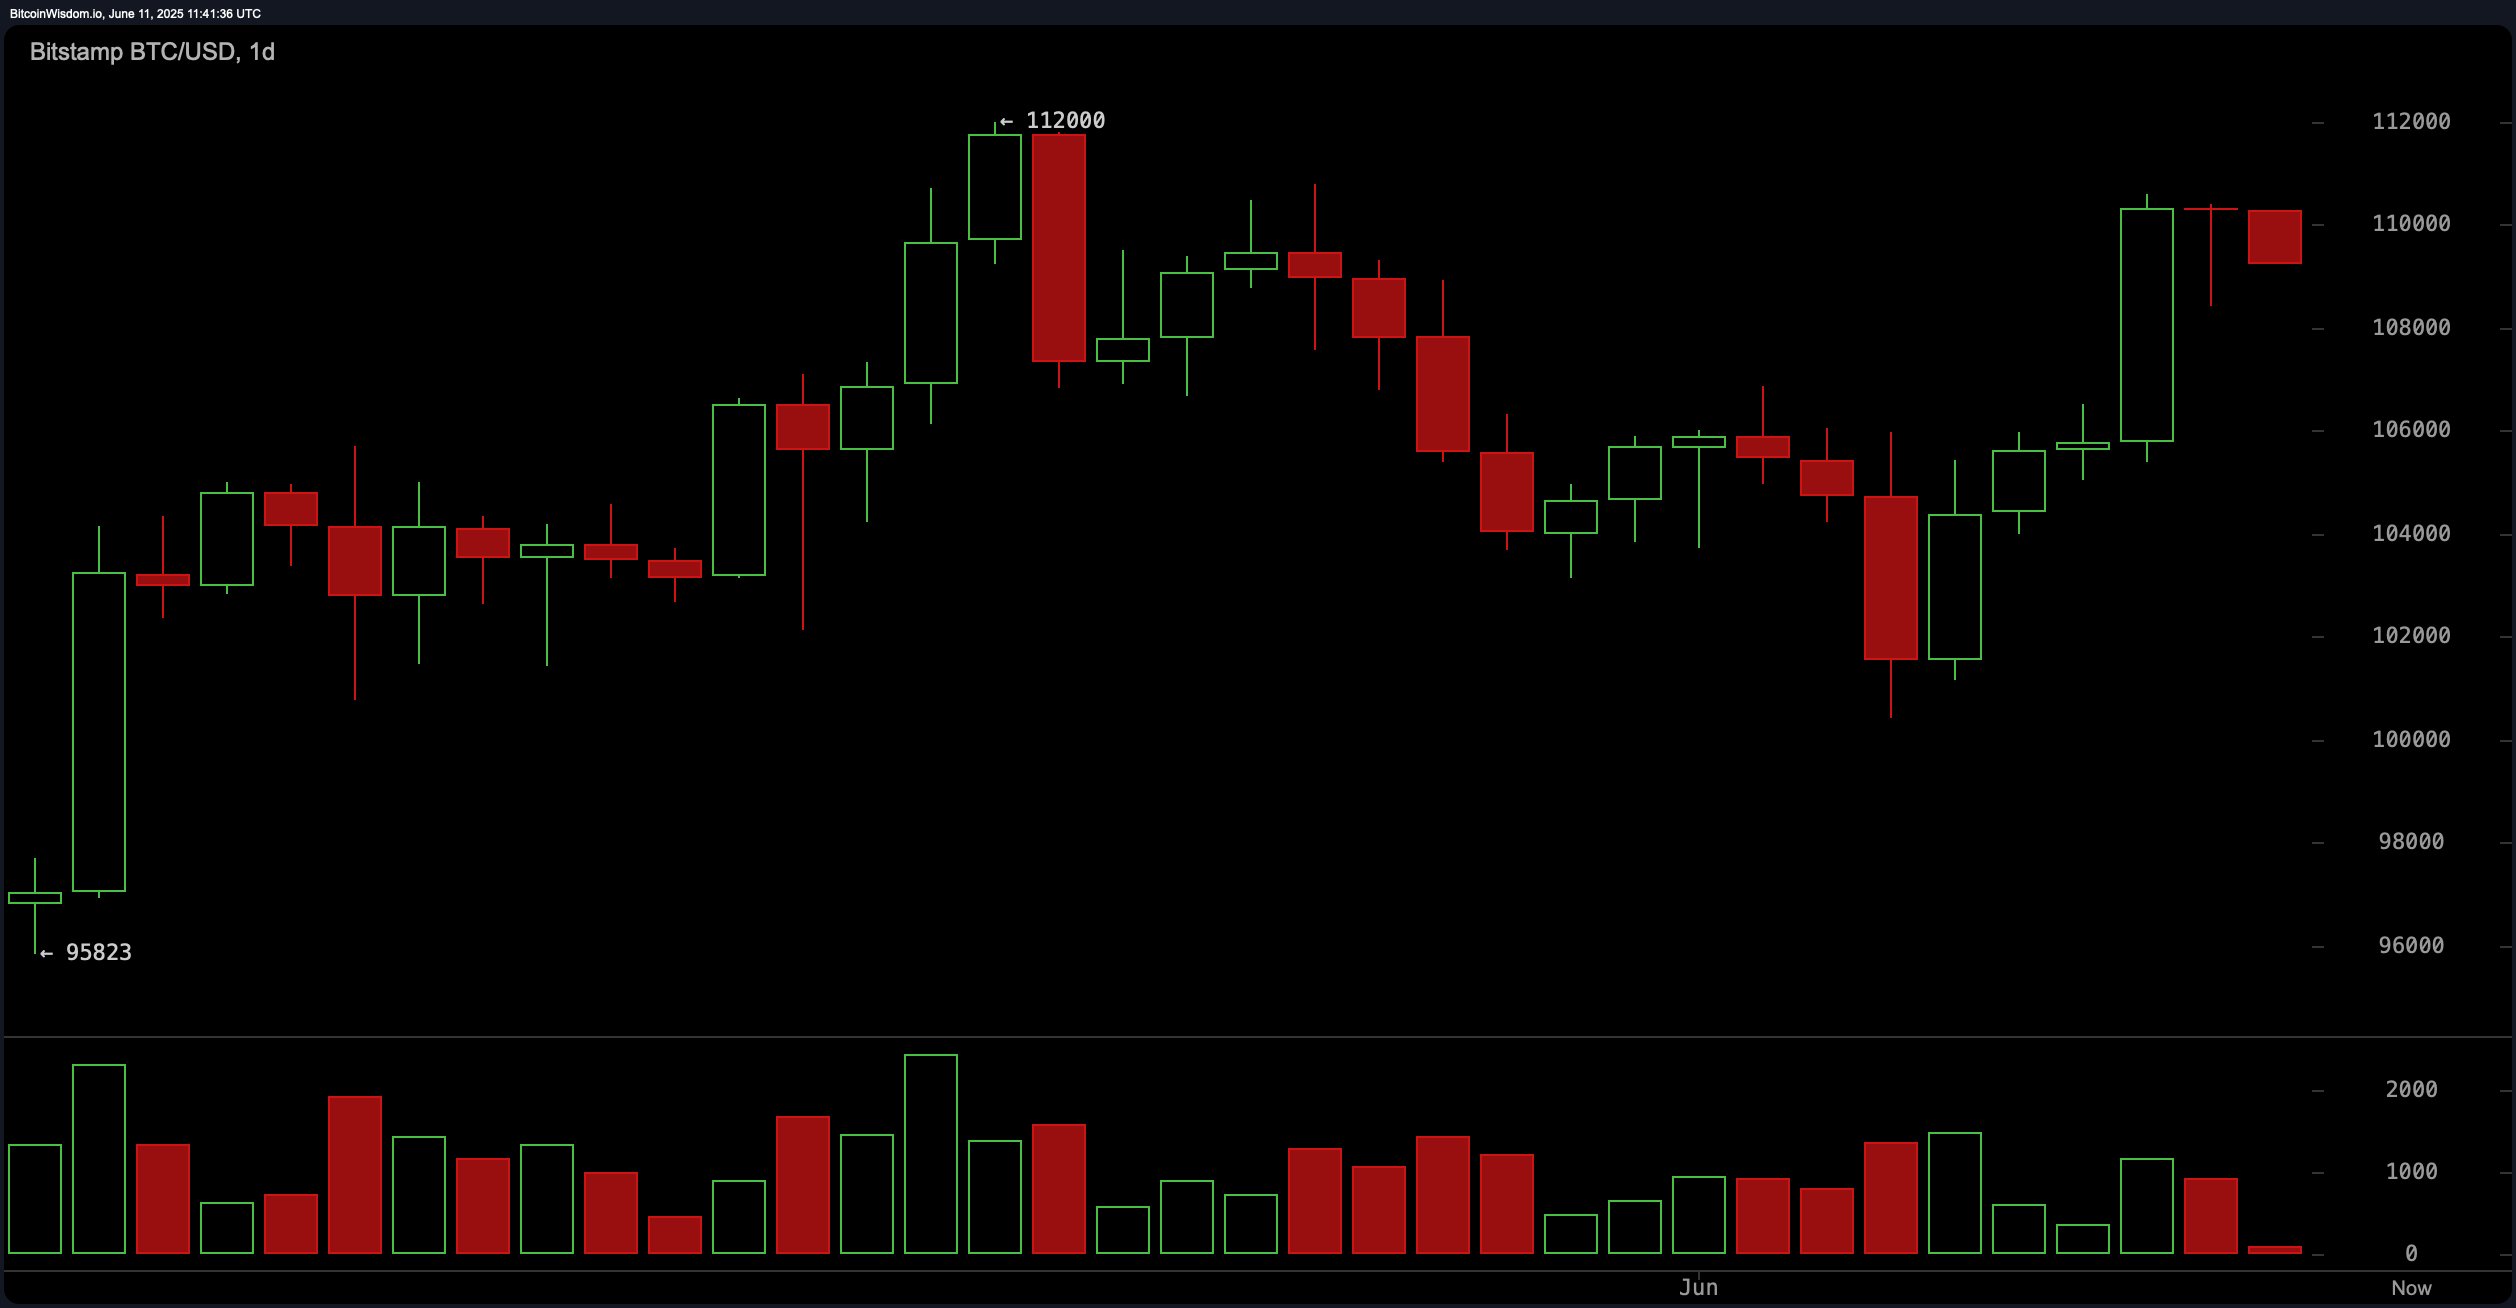
Looking at the daily chart, bitcoin has experienced a bullish rally to $112,000, followed by a correction to the $101,000 level and a partial recovery. Despite this upward trajectory, recent candles indicate hesitancy—low green-day volume and a red candle post-surge imply reduced buying pressure. Key support sits between $100,000 and $101,000, while resistance looms at $112,000. Prudent traders may await a breakout above $112,000 or a dip back to support with a tight stop-loss below.
Oscillator readings across the board point to a neutral stance, reinforcing the market’s current ambiguity. The relative strength index ( RSI) is at 60, Stochastic at 93, commodity channel index (CCI) at 98, average directional index (ADX) at 18, and the awesome oscillator at 1,719—all signaling neutrality. Momentum, however, shows a value of 3,523 and suggests a sell bias, whereas the moving average convergence divergence ( MACD) at 1,469 is in buy territory.
All major moving averages support a bullish outlook. The exponential moving average (EMA) and simple moving average (SMA) from 10 to 200 periods are uniformly flashing buy signals. Notably, the 10-period EMA stands at $107,307 and the 200-period SMA at $95,480, reinforcing a strong long-term uptrend. With prices well above these averages, the underlying trend remains structurally positive, despite short-term consolidation.
In summary, bitcoin appears to be in a temporary cool-off phase within a broader bullish framework. Traders should remain patient, favoring confirmation-based entries either on a breakout beyond $112,000 or a tactical pullback toward $100,000. Until such signals emerge, a cautious stance is warranted given the neutral oscillator alignment and low- volume drift.
Bull Verdict:
Bitcoin remains structurally bullish, with strong support from all major moving averages and the potential for renewed upward momentum on a breakout above $112,000. A sustained push above this resistance could reignite buying interest and set the stage for a fresh rally.
Bear Verdict:
Despite the longer-term bullish trend, signs of waning momentum and neutral oscillator readings suggest vulnerability to a short-term pullback. A breakdown below $108,000, especially on rising volume, could signal a deeper correction toward the $100,000 support zone.