Bitcoin’s price stands at $104,323 on June 18, 2025, supported by a market capitalization of $2.07 trillion and 24-hour trading volume totaling $33.61 billion. With an intraday range of $103,630 to $105,886, bitcoin has remained above the $100,000 threshold for 42 consecutive days, signaling sustained investor interest despite emerging signs of weakness.
Bitcoin Price Watch: Bearish Momentum Builds Despite Holding $100K Line
This article was published more than a month ago. Some information may no longer be current.
WRITTEN BY
SHARE

Bitcoin
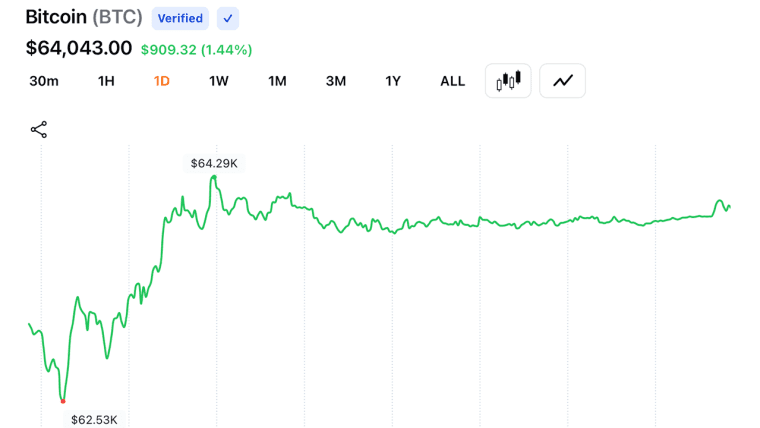
The daily chart indicates bitcoin is consolidating within a well-defined range between $104,000 and $109,000, capped by a strong resistance ceiling at $112,000. Price action suggests a distribution phase, as red volume spikes near peaks hint at selling pressure from larger market participants. Key support has formed around $100,426, a psychologically significant level repeatedly tested and held. A daily close below this threshold could trigger a breakdown, while a breakout beyond $112,000 would resume a bullish continuation.

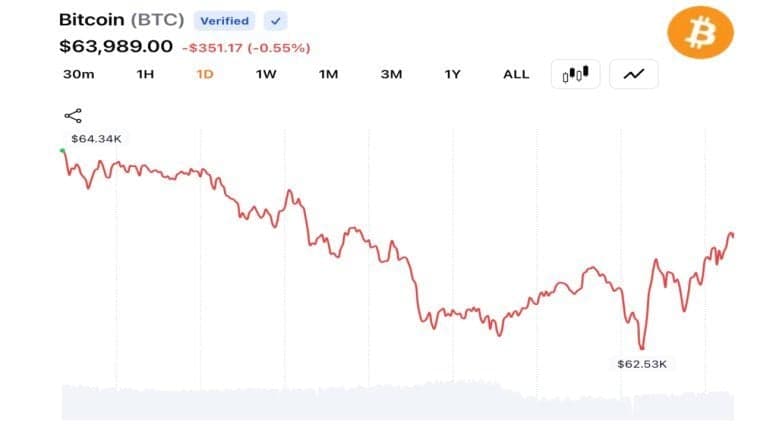
From the 4-hour perspective, bitcoin is displaying signs of weakening momentum. A lower high formed at $108,990 and support retested at $102,816 reveal a tightening range with a bearish undertone. The current price band of $104,000 to $105,000 is witnessing consolidation with diminishing upside attempts. Market participants may consider short entries if the price rebounds toward the $107,000 to $108,000 area and fails to hold, with exit targets near $103,500. A push above $109,000 with volume could negate this bearish setup and favor a shift to a short-term bullish bias.

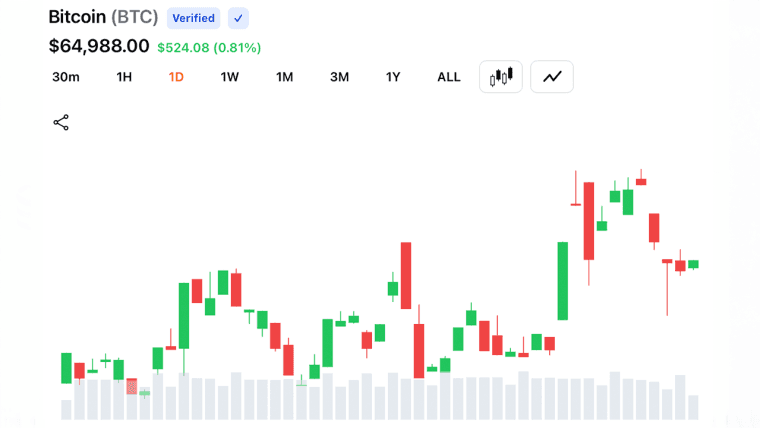
Zooming into the 1-hour chart, bitcoin recently fell sharply from $107,773 to $103,388, entering a minor consolidation marked by indecisive doji and small-bodied candles. The reduction in volume reflects low conviction, with sellers still in control unless buyers step in above $105,000 with volume support. Short positions below $104,000 remain viable with targets near $103,000, while any attempt to move above $106,000 would need validation through a sustained breakout. Until then, short-term sentiment remains bearish.

Technical indicators across oscillators and moving averages (MAs) broadly reinforce the cautious outlook. The relative strength index (RSI) at 47, Stochastic at 47, and commodity channel index (CCI) at -54 all sit in neutral territory, suggesting a lack of immediate directional momentum. However, momentum (10) reads at -1,512 and the moving average convergence divergence (MACD) level at 342 both signal negative momentum, reflecting downside risk. These are compounded by the average directional index (ADX) at 16 and the Awesome oscillator at -682, both pointing to weak trend strength.
MA signals are mixed but generally bearish in the short term. Both the 10-day and 20-day exponential moving averages (EMA) and simple moving averages (SMA) show negative signals. Sell pressure bias extends to the 30-day levels, while the 50-day EMA offers a rare bullish indication. The longer-term 100-day and 200-day EMAs and SMAs are firmly in bullish territory, highlighting a broader positive structure despite short-term corrections. Overall, the technical setup reflects a market in temporary consolidation, with directional clarity likely hinging on a decisive break of either $100,000 or $112,000.
Bull Verdict:
A breakout above $112,000 would signal renewed bullish strength, confirming the continuation of the larger uptrend. With support from longer-term moving averages and bitcoin’s 42-day streak above $100,000, buyers remain well-positioned should momentum return, especially if volume confirms an upward move past key resistance zones.
Bear Verdict:
Failure to defend the $100,000 support could escalate a broader correction, as intraday charts reflect weakening momentum and selling pressure dominates rallies. With short-term moving averages and momentum oscillators aligning on bearish signals, the market risks entering a deeper downtrend unless buying conviction resurfaces soon.