Bitcoin’s price stands at $107,004 as of Oct. 18, 2025, with a 24-hour intraday range between $104,747 and $107,449. The market capitalization is currently valued at $2.13 trillion, supported by a robust daily trading volume of $62.96 billion.
Bitcoin Price Watch: Bear Trend Persists Despite Short-Term Bounce
This article was published more than a month ago. Some information may no longer be current.
WRITTEN BY
SHARE

Bitcoin
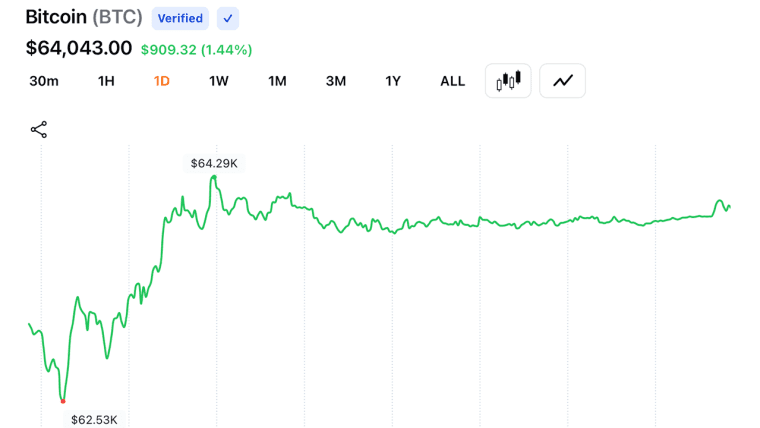
The daily chart reflects a macro bearish trend that began following a peak at $126,272. bitcoin has since undergone significant downside pressure, forming multiple consecutive red candles accompanied by increasing volume—indicative of market-wide capitulation. The price appears to have stabilized above the $103,500–$106,000 support range, with a minor bullish candle emerging in the latest session.
This short-term recovery coincides with the lower boundary of an established range, signaling potential for a temporary reversal should momentum continue. However, upside targets remain constrained by heavy resistance in the $114,000–$116,000 zone, with even stronger supply expected between $120,000 and $122,000.

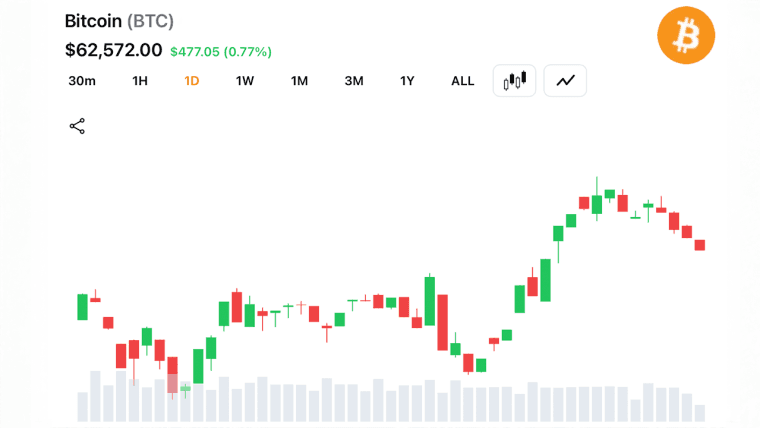
On the 4-hour chart, bitcoin‘s structure remains decisively bearish, as evidenced by the formation of lower highs and lower lows. The steep decline from $126,000 was only weakly contested by a bounce that failed to reclaim the $114,000 mark. Since bottoming out at $103,530 with notable volume, bitcoin has entered a range-bound phase, fluctuating between $106,000 and $108,000. A confirmed breakout above $108,500, particularly with strong volume, would suggest short-term upward momentum. Conversely, a breakdown below $103,500 would expose the $100,000 psychological level as the next major area of interest.

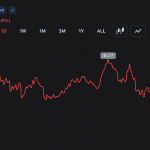
The 1-hour bitcoin chart reveals a classic stair-step decline, culminating in a bounce from $103,530 and subsequent lateral movement between $106,000 and $107,000. This phase of consolidation has been characterized by declining volume, often interpreted as accumulation. Immediate resistance lies between $108,000 and $108,500, which acts as the near-term ceiling. A break above this range with accompanying volume could trigger a short-lived upward move toward $110,000–$112,000. However, renewed weakness below $105,500 would likely test the $103,500 level again, especially if volume increases on the breakdown.

Oscillators show mixed signals. The relative strength index (RSI) sits at 36, reflecting neutral conditions with potential room for upward movement. The Stochastic oscillator at 11 and the commodity channel index (CCI) at -124 both suggest conditions that have historically preceded price rebounds. Meanwhile, the average directional index (ADX) at 27, awesome oscillator at -5,681, and momentum at -16,308 all point to a weakening trend, while the moving average convergence divergence (MACD) remains negative at -1,881—both signaling persistent bearish pressure.
Moving averages across all key timeframes reflect a dominant downward trend. The exponential moving averages (EMAs) for 10 through 200 periods all stand above current price levels, with the 10-period EMA at $111,599 and the 200-period EMA at $108,066. Likewise, the simple moving averages (SMAs) exhibit a similar configuration, with the 200-period SMA at $107,637, underscoring the prevailing downtrend. These indicators suggest that bitcoin must overcome multiple technical barriers before any sustained bullish outlook can be considered credible.
Bull Verdict:
If bitcoin maintains support above $103,500 and breaks through the $108,500 resistance with meaningful volume, the structure favors a short-term recovery toward $114,000. A sustained move above that level could begin to shift sentiment, suggesting the potential for a trend reversal and renewed momentum toward higher resistance zones.
Bear Verdict:
Unless bitcoin decisively reclaims the $114,000 level and establishes a higher low structure, the prevailing trend remains downward. Continued rejection at key resistance zones, paired with weakening momentum indicators and bearish moving averages, reinforces the likelihood of further downside, with $100,000 emerging as the next critical support.
FAQ
- Where is bitcoin’s current support level?
Bitcoin is holding short-term support between $103,500 and $106,000. - What price levels are key for resistance?
Major resistance zones are located at $108,500, $114,000, and $120,000. - Is the bitcoin trend bullish or bearish right now?
The broader trend remains bearish despite short-term neutral signals. - How much is bitcoin being traded daily?
Bitcoin’s 24-hour trading volume is approximately $62.96 billion.