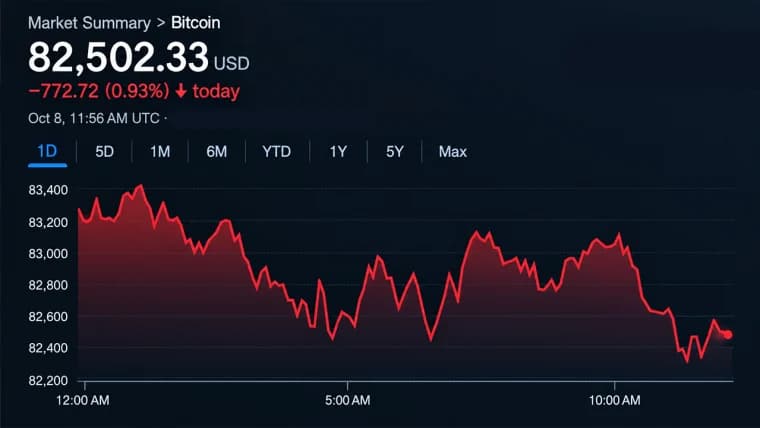



At 9:30 a.m., bitcoin’s price was clocking roughly $79,750 to $80,100 per unit on Sept. 6, stuck in a tight weekend range after its early-September run above $82,000 lost steam. There’s a great deal happening under the surface, though: BTC’s price remains above every listed major daily simple moving average (SMA) and exponential moving average (EMA), while weaker momentum readings and thin weekend trading volume show that another significant breakout has yet to be confirmed.
Bitcoin Price Faces $82K Wall as Weekend Momentum Fizzles

This article was published more than a month ago. Some information may no longer be current.
WRITTEN BY

SHARE
Key Takeaways
- Bitcoin’s price held between $79,750 and $80,100 on Sunday morning as its daily uptrend remained intact.
- Bitstamp’s BTC/USD tape stayed between $79,586 and $80,147 as weekend volume thinned.
- Bitcoin faces $80,335-$82,239 resistance before bulls can confirm another breakout.
Bitcoin’s 1-Hour Chart Keeps Bulls and Bears Walking a Tightrope
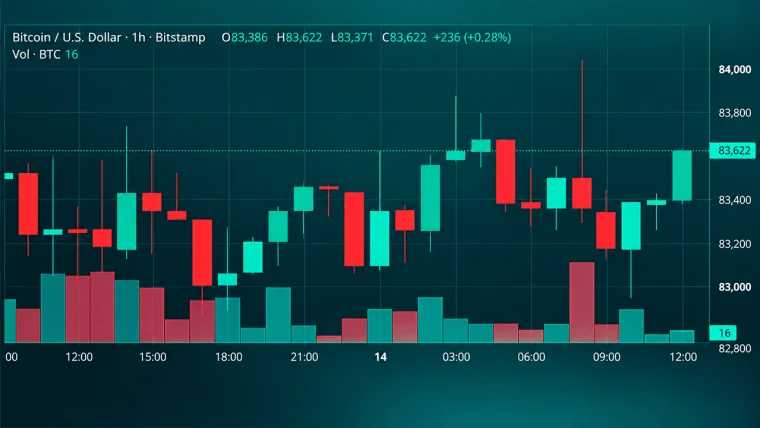
Bitcoin’s price on the 1-hour chart is basically a waiting game after a wild ride earlier in the week. Over the last hour, Bitstamp’s 24-hour tape logged bitcoin’s price between $79,750 to $80,100 around 9:30 a.m., while hourly candles since Friday’s flush have been small and overlapping inside the range.
Volume has also fallen sharply, which is typical during the weekends, with Saturday and Sunday bars clocking a fraction of the Sept. 3-4 spike. Instead of picking up steam in either direction, BTC is sitting inside a narrow rangebound balance where neither buyers nor sellers are back in the driver’s seat.
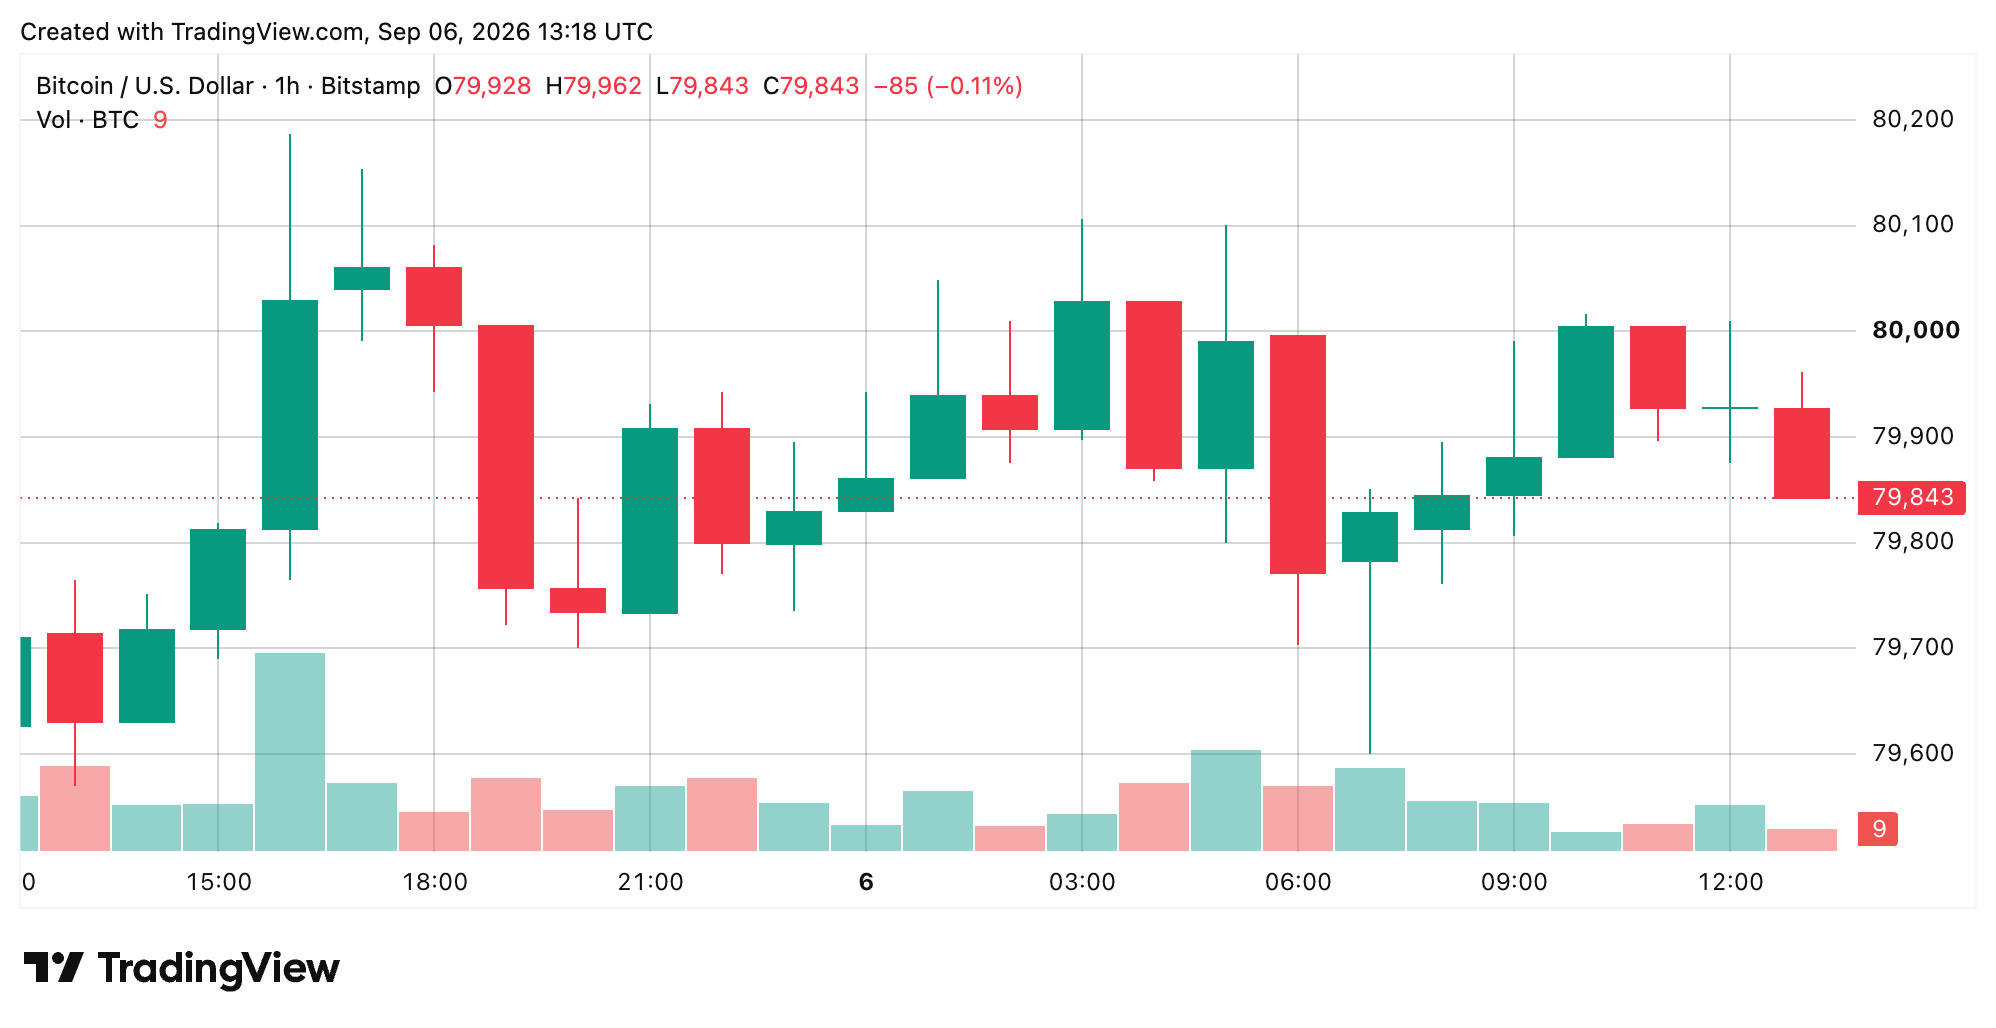
Notably, the immediate battle is taking place across a range of only a few hundred dollars. The intraday balance box runs from $79,586 to $80,147. A break and hold above $80,147 would put $80,335 and then $80,523 in the cards. On the flip side, a break and hold below $79,586 would point toward $78,650. Traders are also dealing with thin weekend liquidity, so a move out of the box without stronger volume could leave the market playing with fire.
Bitcoin’s 4-Hour Chart Shows the Market Putting the Brakes On
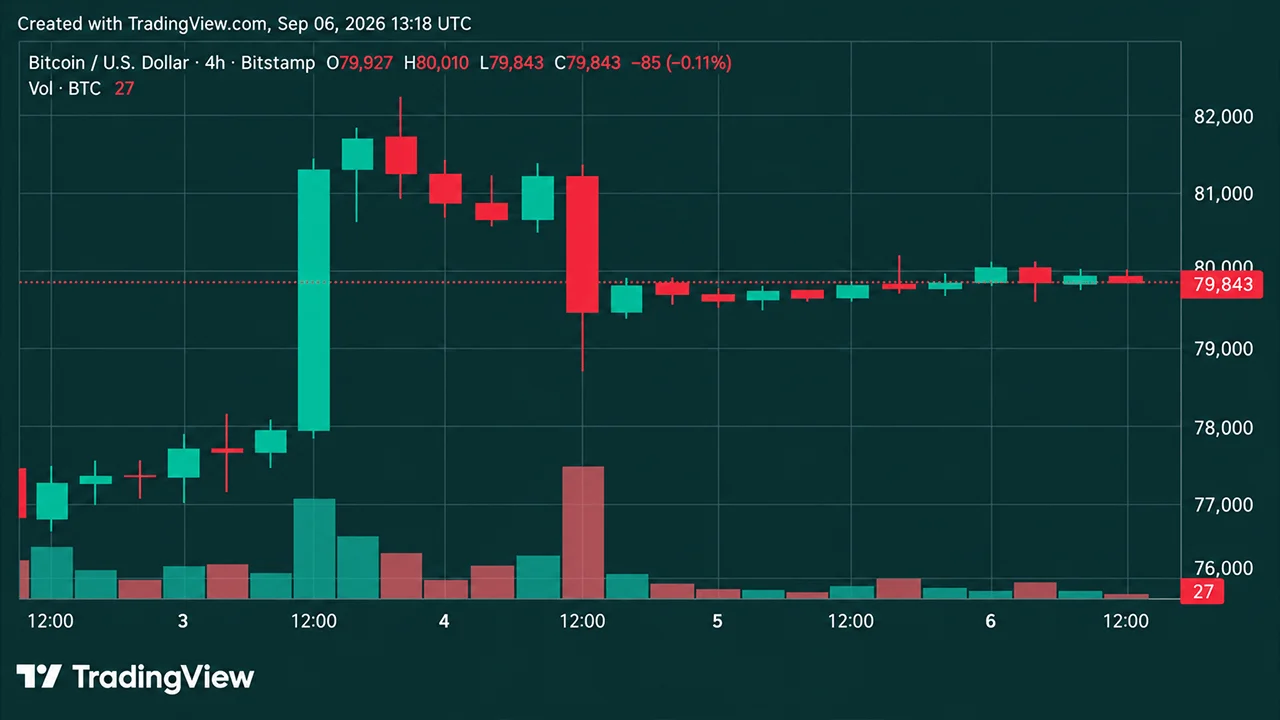
Zooming out to the 4-hour structure shows exactly how bitcoin’s price ended up here. The market came out swinging on Sept. 3, pushing into roughly $81,400 to $82,200 before that advance was rejected. Bitcoin then got hammered back into the high-$78,000s on Sept. 4 before mean-reverting into the $79,500 to $80,200 area over the next two sessions. Since then, both range and volume have pretty much collapsed. Bitcoin’s price is now parked near the roughly $79,900 to $80,100 midpoint, meaning the market is stabilizing after its failed push at resistance rather than starting a fresh trend leg.
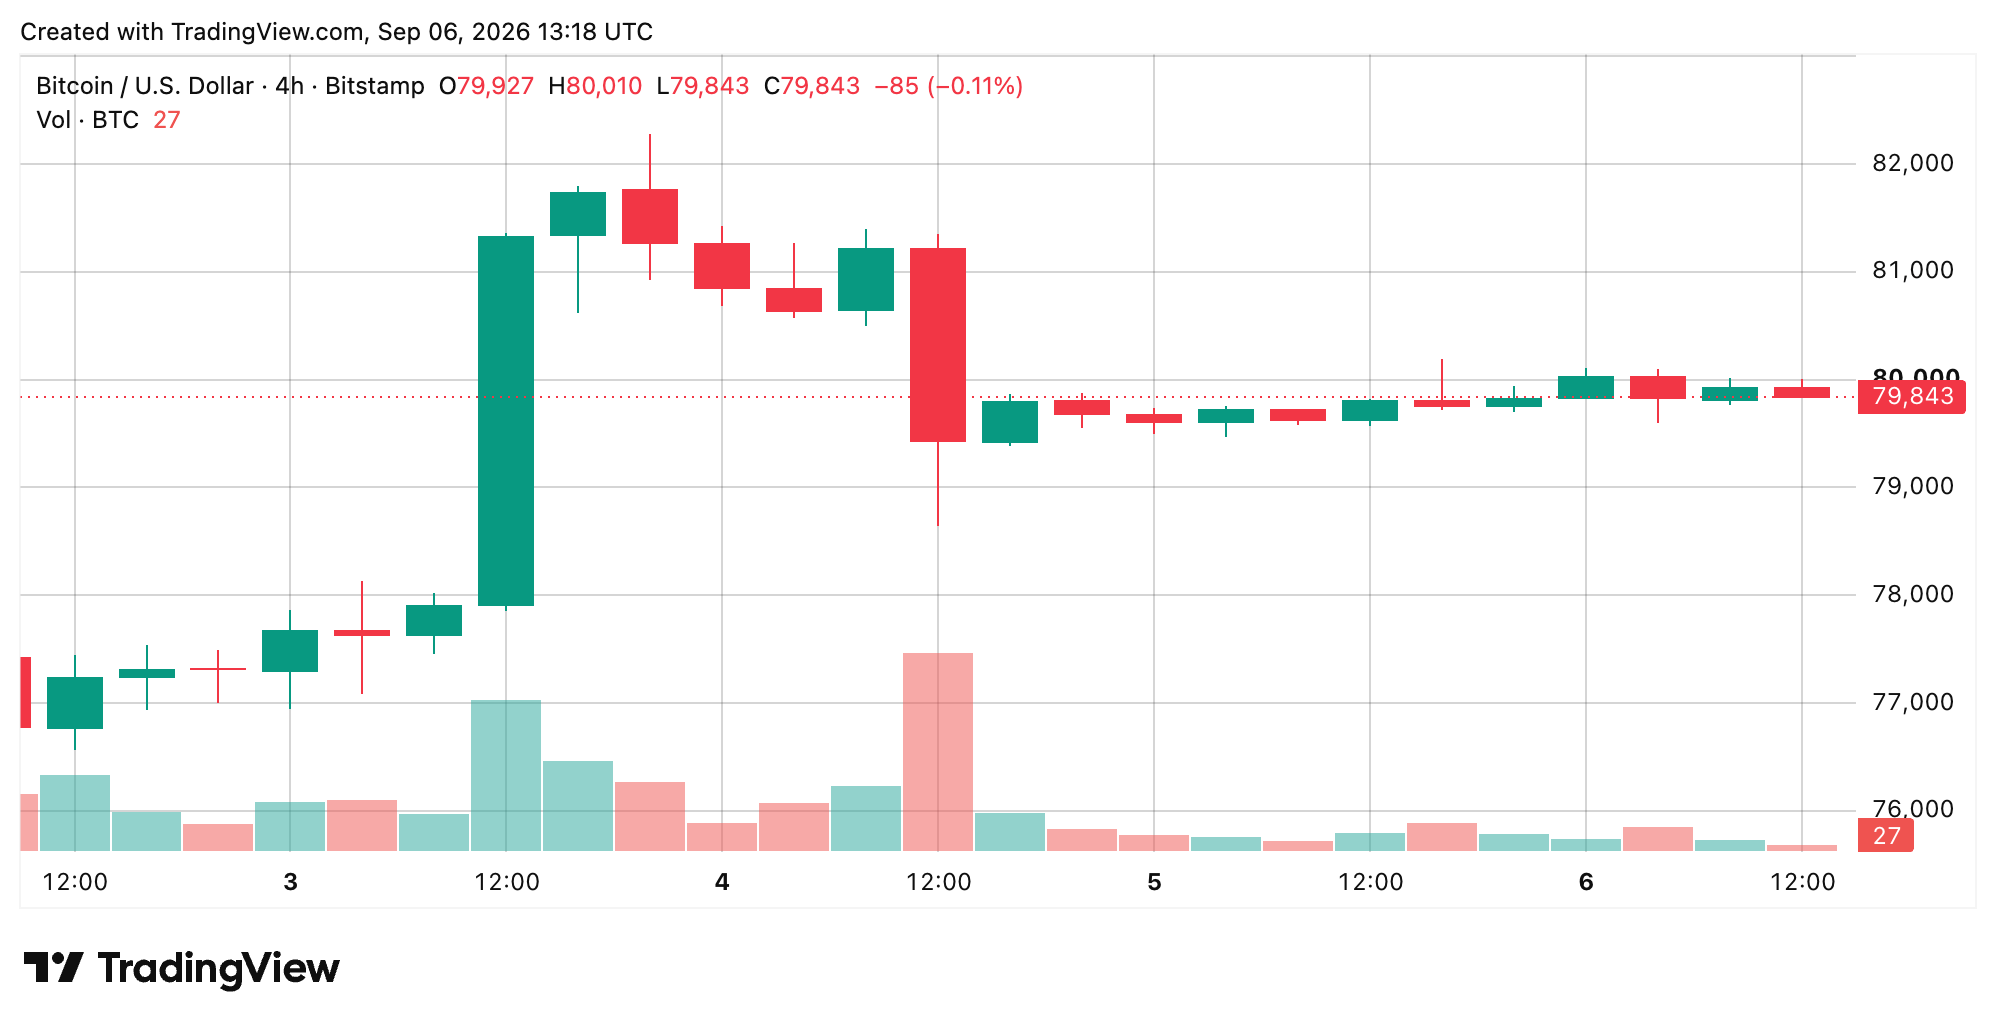
It is worth noting that this makes the next 4-hour close significant. A close below $79,586 would open the Sept. 4 flush pocket around $78,650 to $78,700. On the other hand, buyers need a 4-hour or daily close through $80,335 and then $81,430 for the first evidence that bitcoin is retesting its Sept. 3 high with acceptance. Until that happens, calling another run toward the highs would jump ahead of the data. For now, whether buyers or sellers take control is anyone’s guess because the observable structure is strictly a range.
Bitcoin’s Daily Upswing Is Not Out of the Woods Yet
Bitcoin’s price action on the daily chart is where bulls have a great deal more going for them. Bitcoin formed a higher-low base around $58,000 to $64,000 in midsummer before its late-August advance kicked seriously into high gear and reached roughly $82,239 on Sept. 3. The market gave back part of that move Sept. 4, while Sept. 5 and Sept. 6 developed into tight inside days. Sunday’s candle had logged a $79,830 open, $80,106 high, $79,600 low and $79,910 last price, keeping the broader rebound intact but paused.
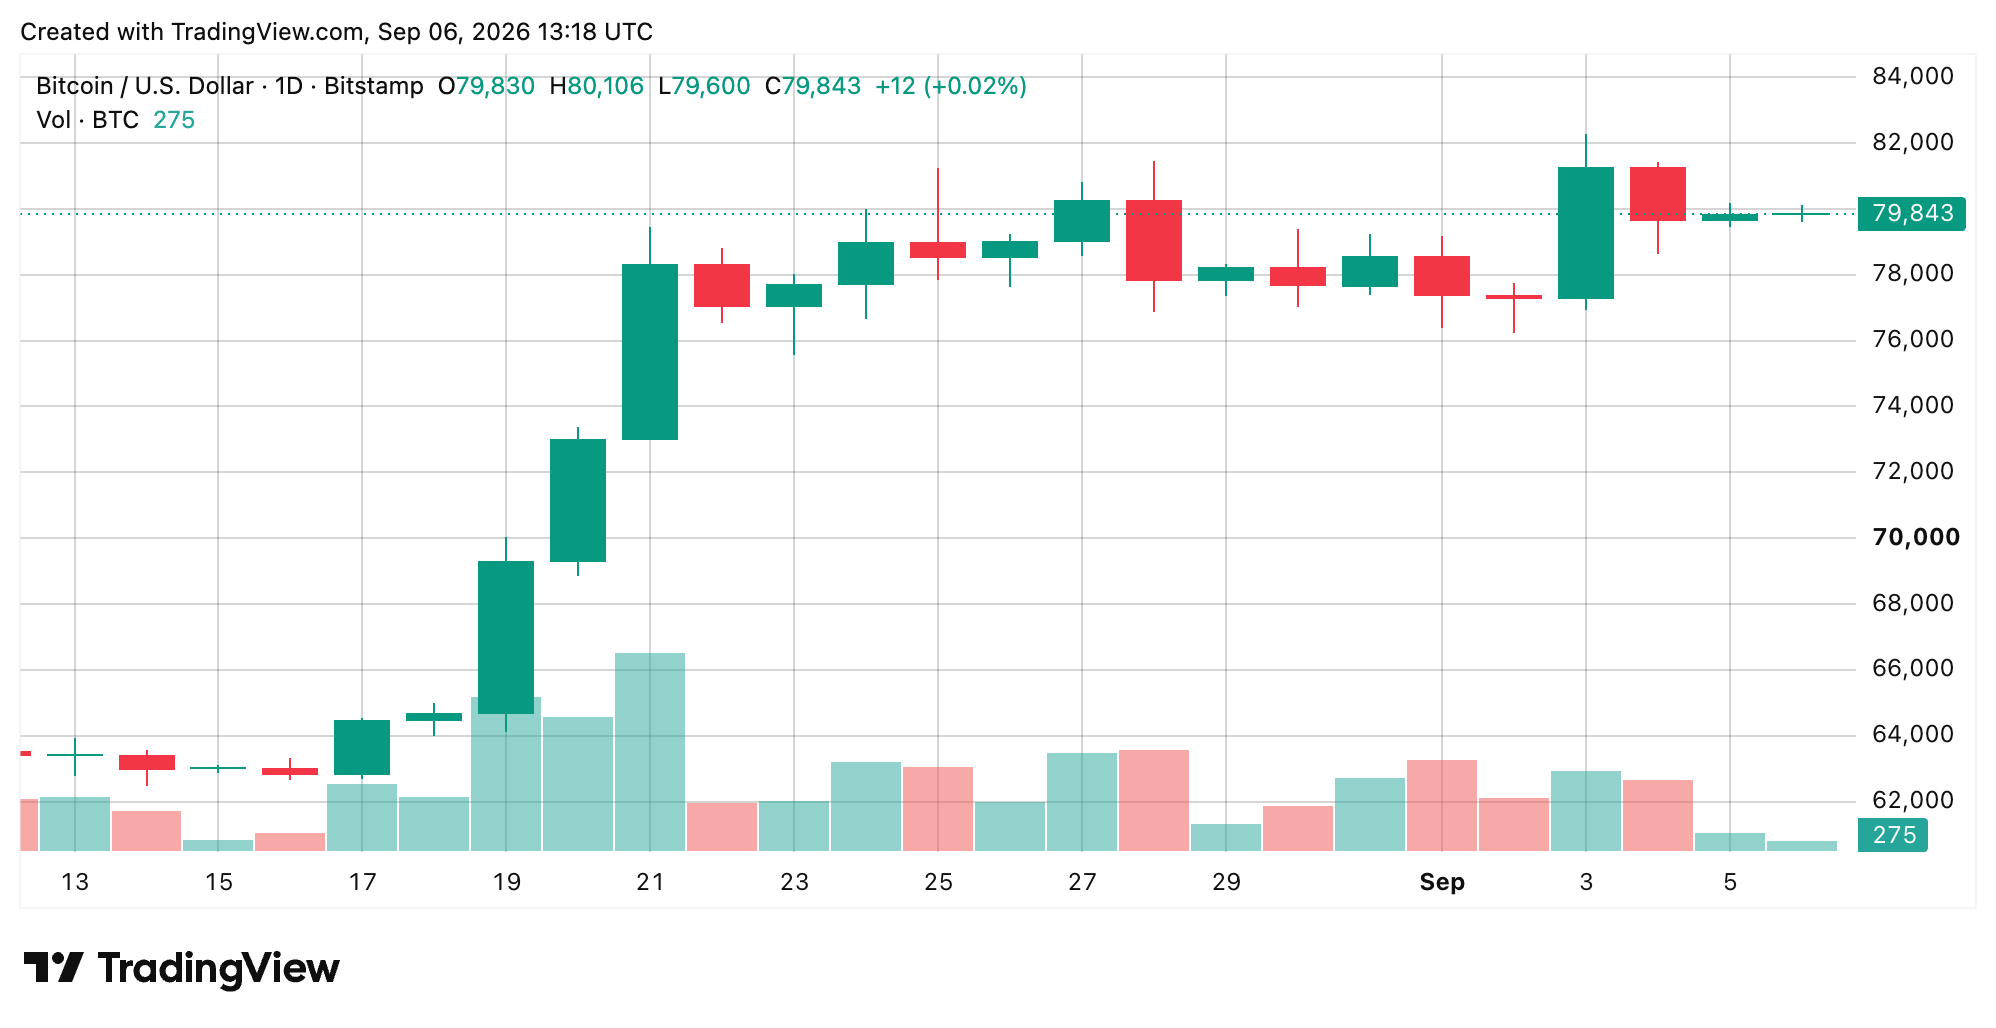
The leading crypto asset is still above its 10-day and 20-day averages at $78,771 and $77,231, respectively, but it has not reclaimed the Sept. 3 spike. Volume is another reason the bulls are not out of the woods yet. Market statistics this weekend show $20.21 billion in 24-hour turnover, well below the roughly $35 billion to $40 billion prints from Sept. 4-5. A renewed test of the $80,335 to $82,239 resistance zone remains in the cards if price can actually clear the mapped levels, but the current data shows a market running out of steam rather than one already breaking loose.
Oscillators Are All Over the Place as Momentum Cools
The daily chart’s oscillator readings are where the 24-hour picture gets more mixed. Today the relative strength index (RSI) stands at 67, elevated but below the classic 70 overbought threshold. The Stochastic stood at around 62, the commodity channel index (CCI) is 72, the average directional index (ADX) on Sunday morning clocked 47, and the Awesome oscillator, also called AO, logged 7,714, with all five rated neutral. The ADX reading also indicates a still-present trend. Still, the overall oscillator gauge stands impartial, logging two bearish readings, nine uncommitted readings, and zero bullish readings.
Here comes the plot twist: The momentum oscillator reads minus 379 and rated negative, while the moving average convergence divergence (MACD) level on Sunday stood at 3,230 and was also rated bearish. Those two readings line up with the post-spike cooling that followed the recent Sept. 3 high. So while the daily price structure has not gone off the rails, momentum is not confirming a new high either. For the immediate setup, BTC still needs more evidence before another breakout can be confirmed.
Moving Averages Keep Bulls in the Driver’s Seat, for Now
Having said that, the moving-average (MA) stack this weekend still looks considerably stronger. The 10-, 20-, 30-, 50-, 100- and 200-period exponential moving averages (EMAs) and simple moving averages (SMAs) all carry bullish signals, with bitcoin’s price above every listed one. The daily chart’s moving-average gauge logged 13 positive signals, one neutral reading, and one bearish signal, producing an overall strong reading for bullish traders. That is a significant contrast with the cooler oscillator picture mentioned above, and helps explain why the daily upswing remains intact even as short-term momentum has put the brakes on.
The lone moving-average downbeat signal was the Hull moving average (HMA) at $80,523, which sits just overhead and adds another obstacle to an already crowded resistance area. Below the market, the 20-period SMA at $77,231, 20-period volume weighted moving average (VWMA) at $76,714, and 20-period EMA at $76,441 per coin form an important daily support cluster. A daily close below that mentioned bundle would cancel the current “price above all major daily moving averages” bid.
Until the dust settles, $80,335 to $82,239 above and $79,586 followed by $78,650 below are the levels that could move the needle. The current foundation still stands at $76,200 and the psychological $75,000 zone. In the derivatives market right now, options bets are showing bullish fervor. Calls this weekend equate to 61.69% of open interest, compared with 38.31% for puts, according to stats logged by Coinglass.com. On Binance, bitcoin’s max pain level sits in the low-$70,000s, with later expirations ranging roughly from $60,000 to $80,000 per unit.
Bull Verdict:
At 9:30 a.m. on Sunday morning, the daily trend still leans bullish. Bitcoin’s Price remains above every listed major daily moving average. Clearing $80,335 would strengthen the setup. A push through $81,430 could put the September highs back in contention.
Bear Verdict:
Bitcoin is still walking a tightrope above the $79,000 mark today. Momentum and the MACD level are flashing bearish signals this weekend. Losing $79,586 would weaken the short-term setup. A deeper drop could bring $78,650 back into play.

Bitfinex analysts explained that this indicator, based on bitcoin price volatility, has had a positive week for the first time…
Read Now: Bitfinex Flags Bullish Bitcoin Price Signal on Weekly Super Trend Chart