


With a 24-hour trading range between $89,596 and $91,924 and a current price of $90,617, bitcoin’s Saturday session delivered more of a yawn than a roar. Its $1.8 trillion market cap and $32.66 billion in trading volume suggest there’s still plenty of interest—but interest isn’t momentum, and momentum is exactly what’s missing.
Bitcoin Hits the Brakes at $90K—Is the Rally Running out of Gas?

This article was published more than a month ago. Some information may no longer be current.
WRITTEN BY

SHARE

Bitcoin Chart Outlook
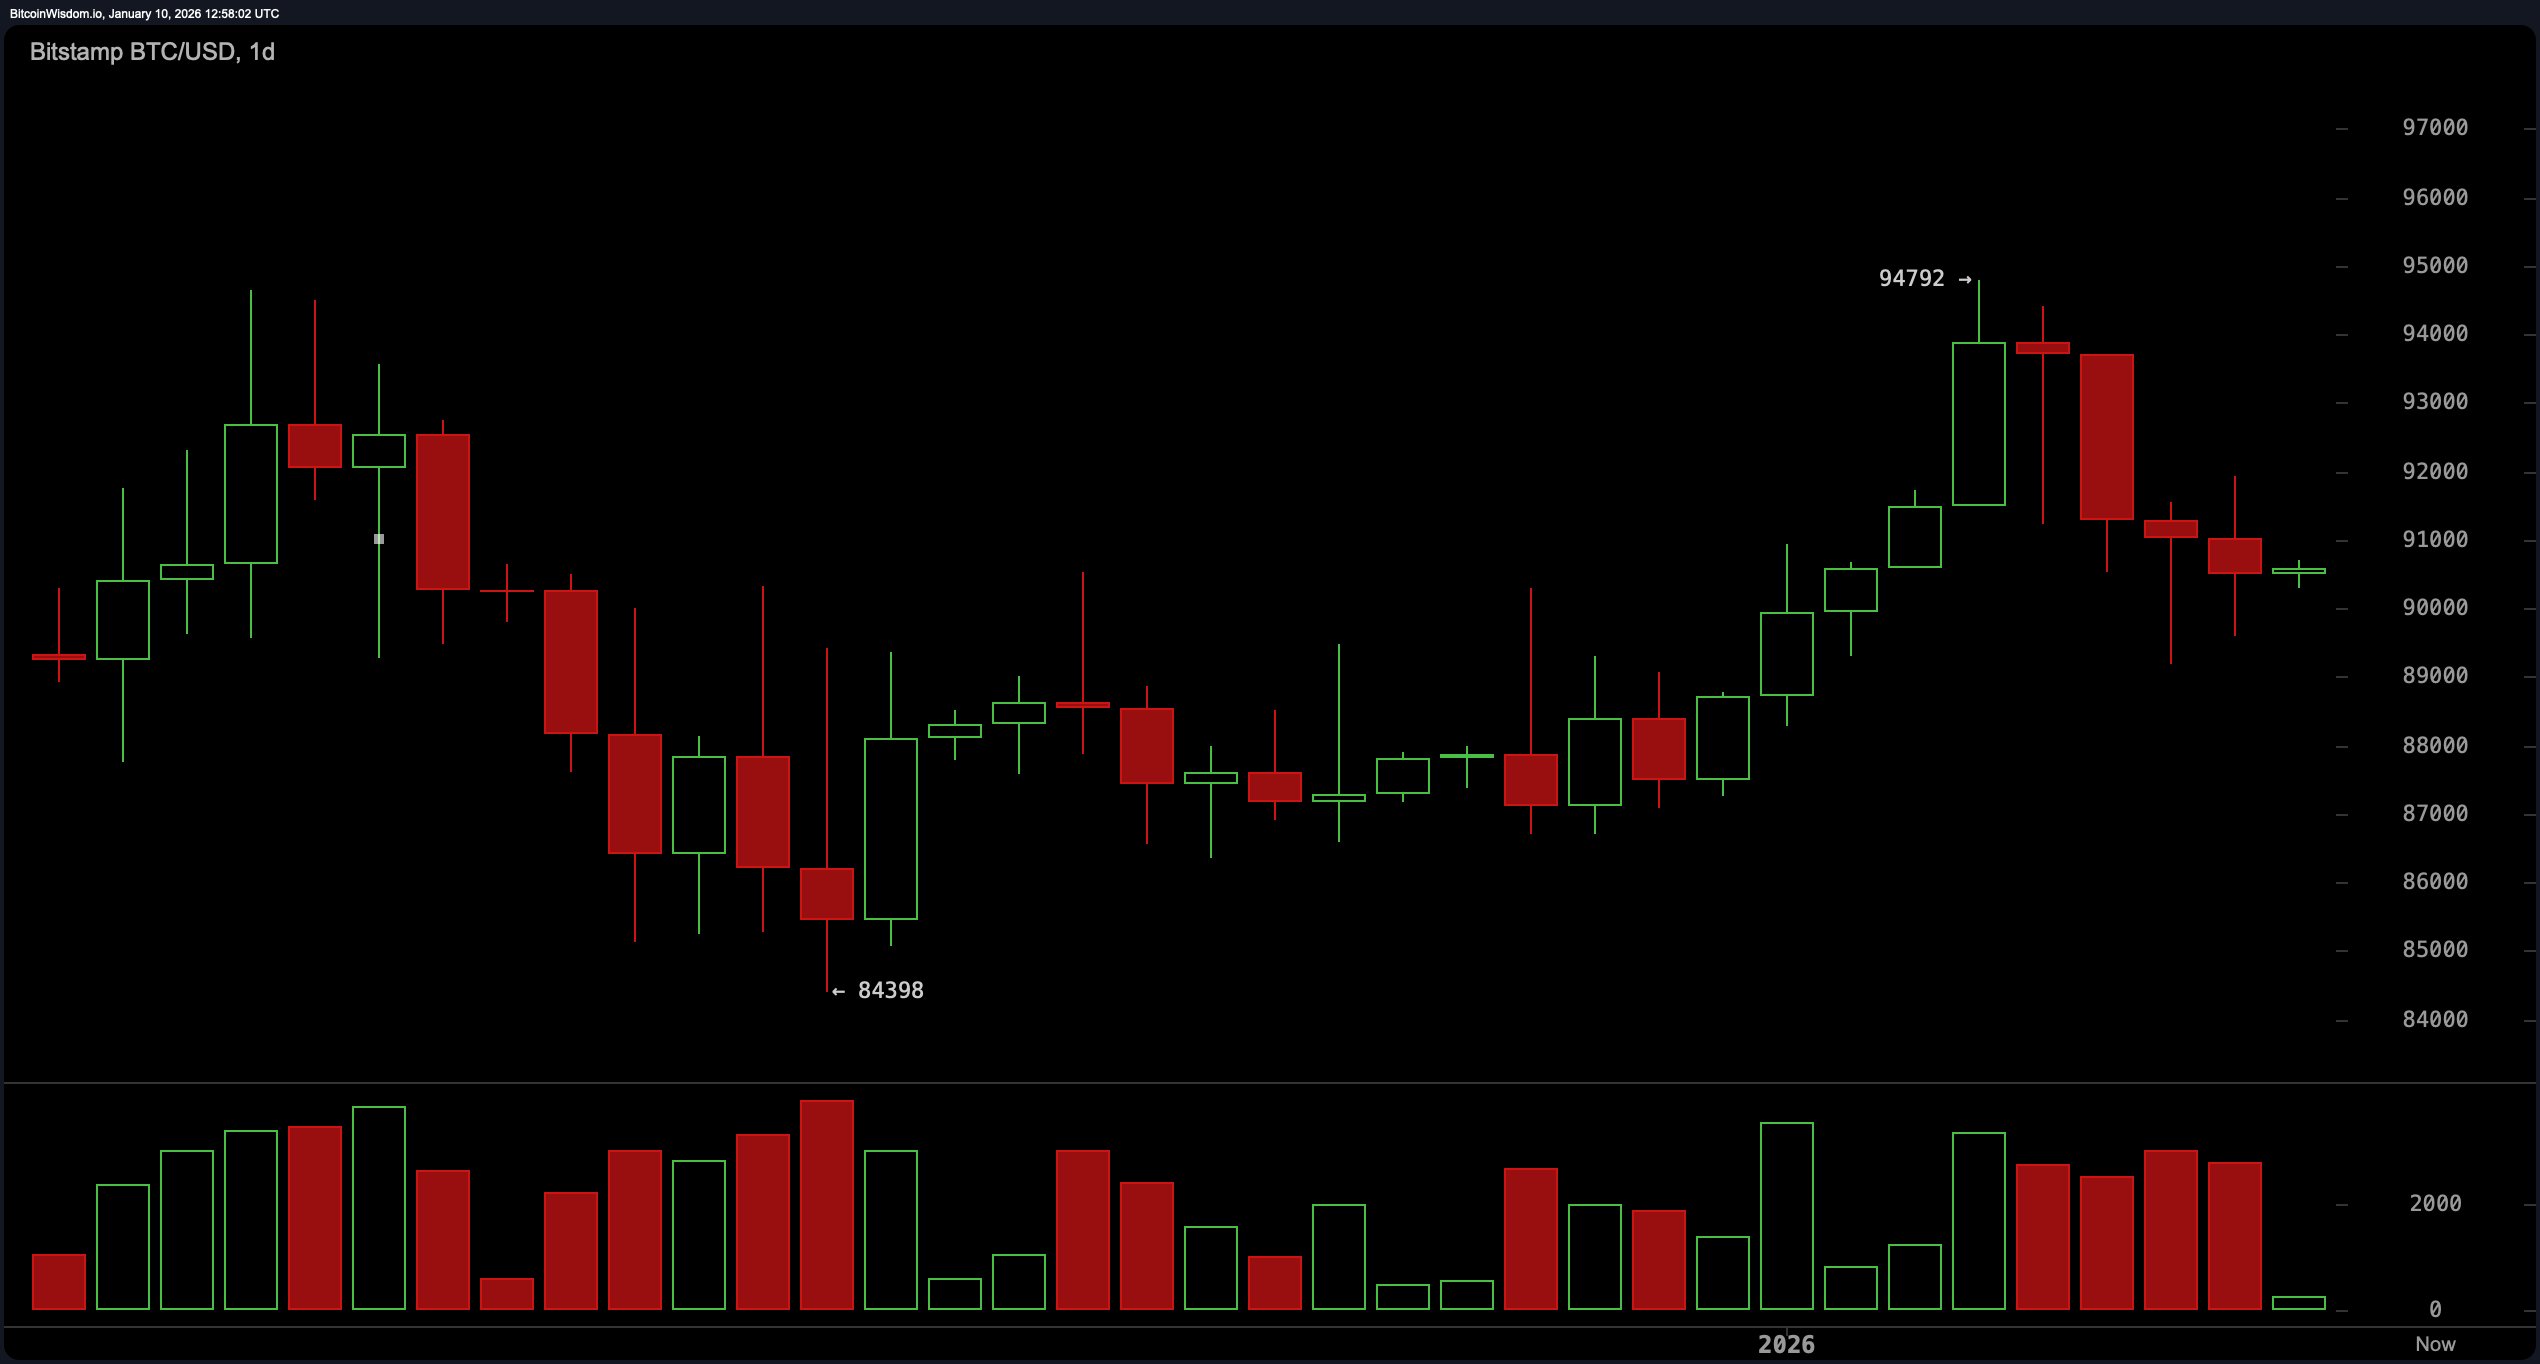
The daily chart reads like the end of a sprint—bitcoin charged from $84,398 to $94,792 before abruptly losing steam. The recent three-day pullback has brought the price back down to a holding pattern around $91,000. Notably, declining volume during this retreat was unusually high, a textbook sign of bearish pressure despite a relatively small-bodied daily candle.
That candle, caught between hesitation and exhaustion, suggests a classic moment of indecision. Traders watching this frame will need to see a strong close above $92,000—ideally with volume riding shotgun—before entertaining another test of the $94,000 to $95,000 resistance ceiling.
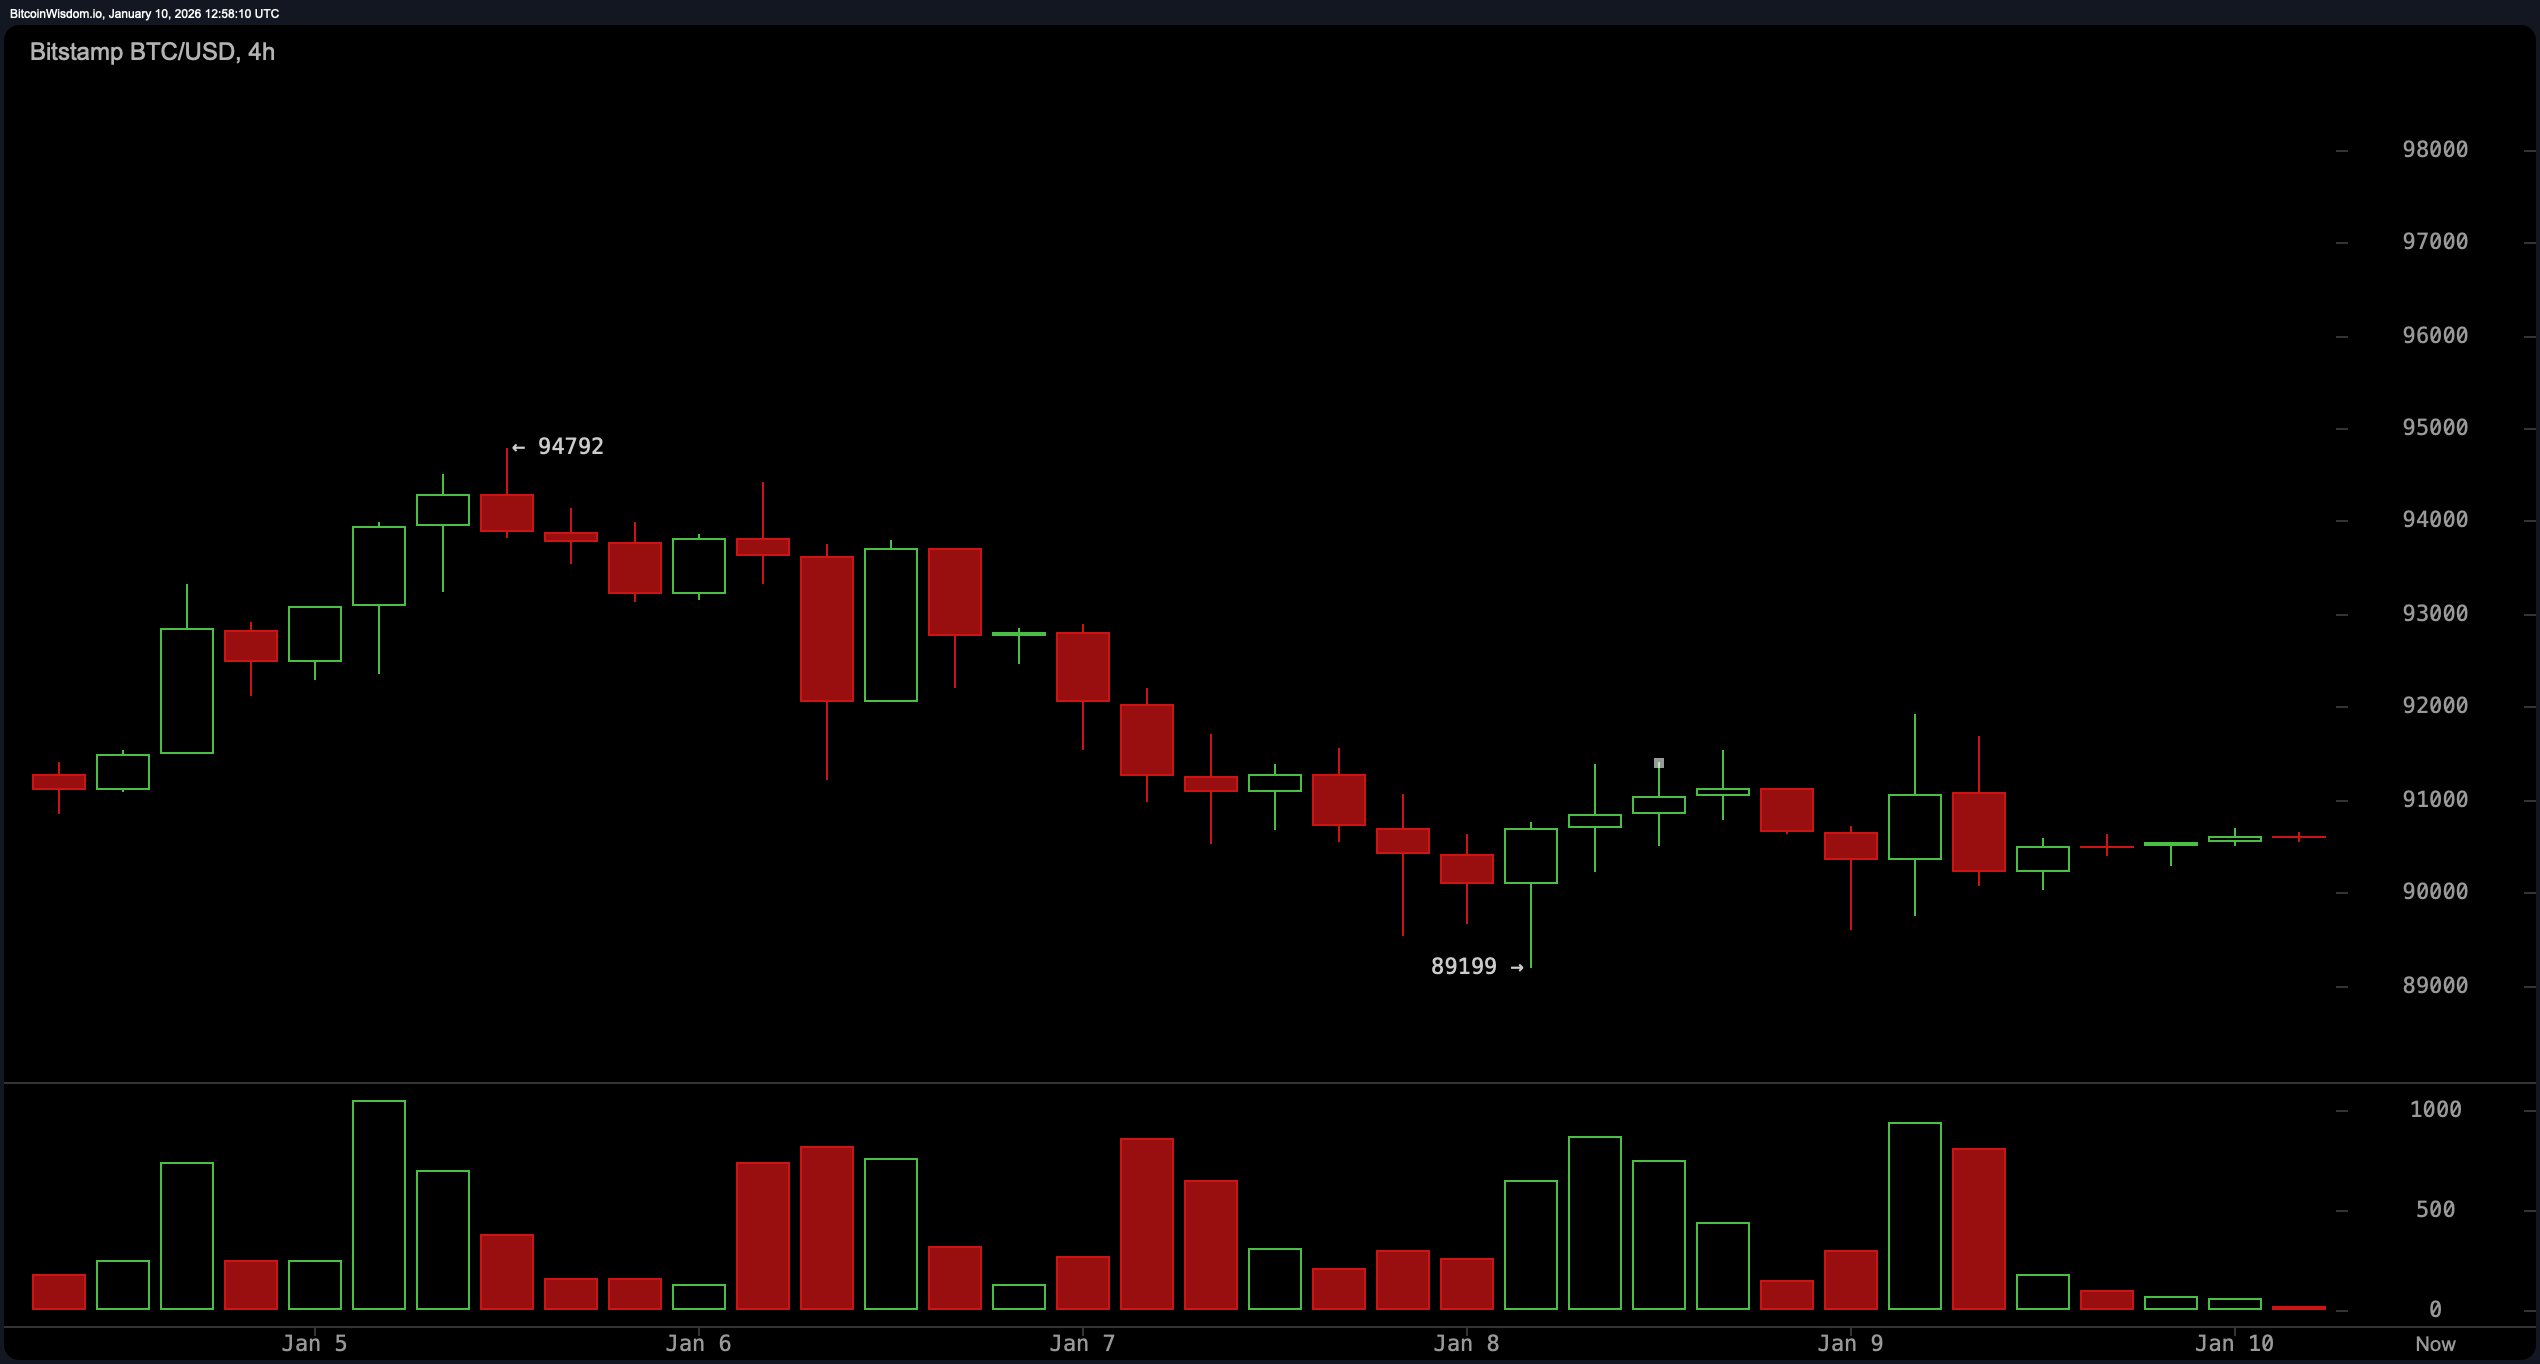
Zoom into the 4-hour chart, and the optimism starts to peel away. Bitcoin has been drifting sideways in the $90,000 to $91,000 pocket, with price structure hinting at a potential bear flag—a consolidation after a drop, not a party invitation. Volume on green candles has been underwhelming, signaling that buyer enthusiasm is either missing or terribly miscalculated. A decisive breakdown below $90,000 could open the door to a re-test of the $88,500 to $89,000 support zone, especially if volume supports the fall.
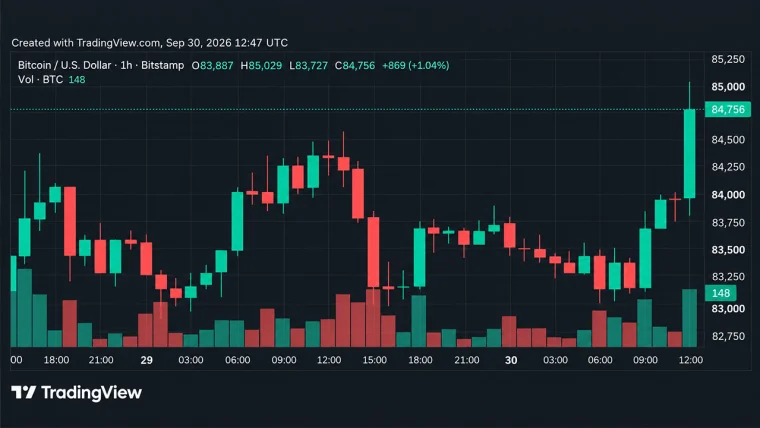
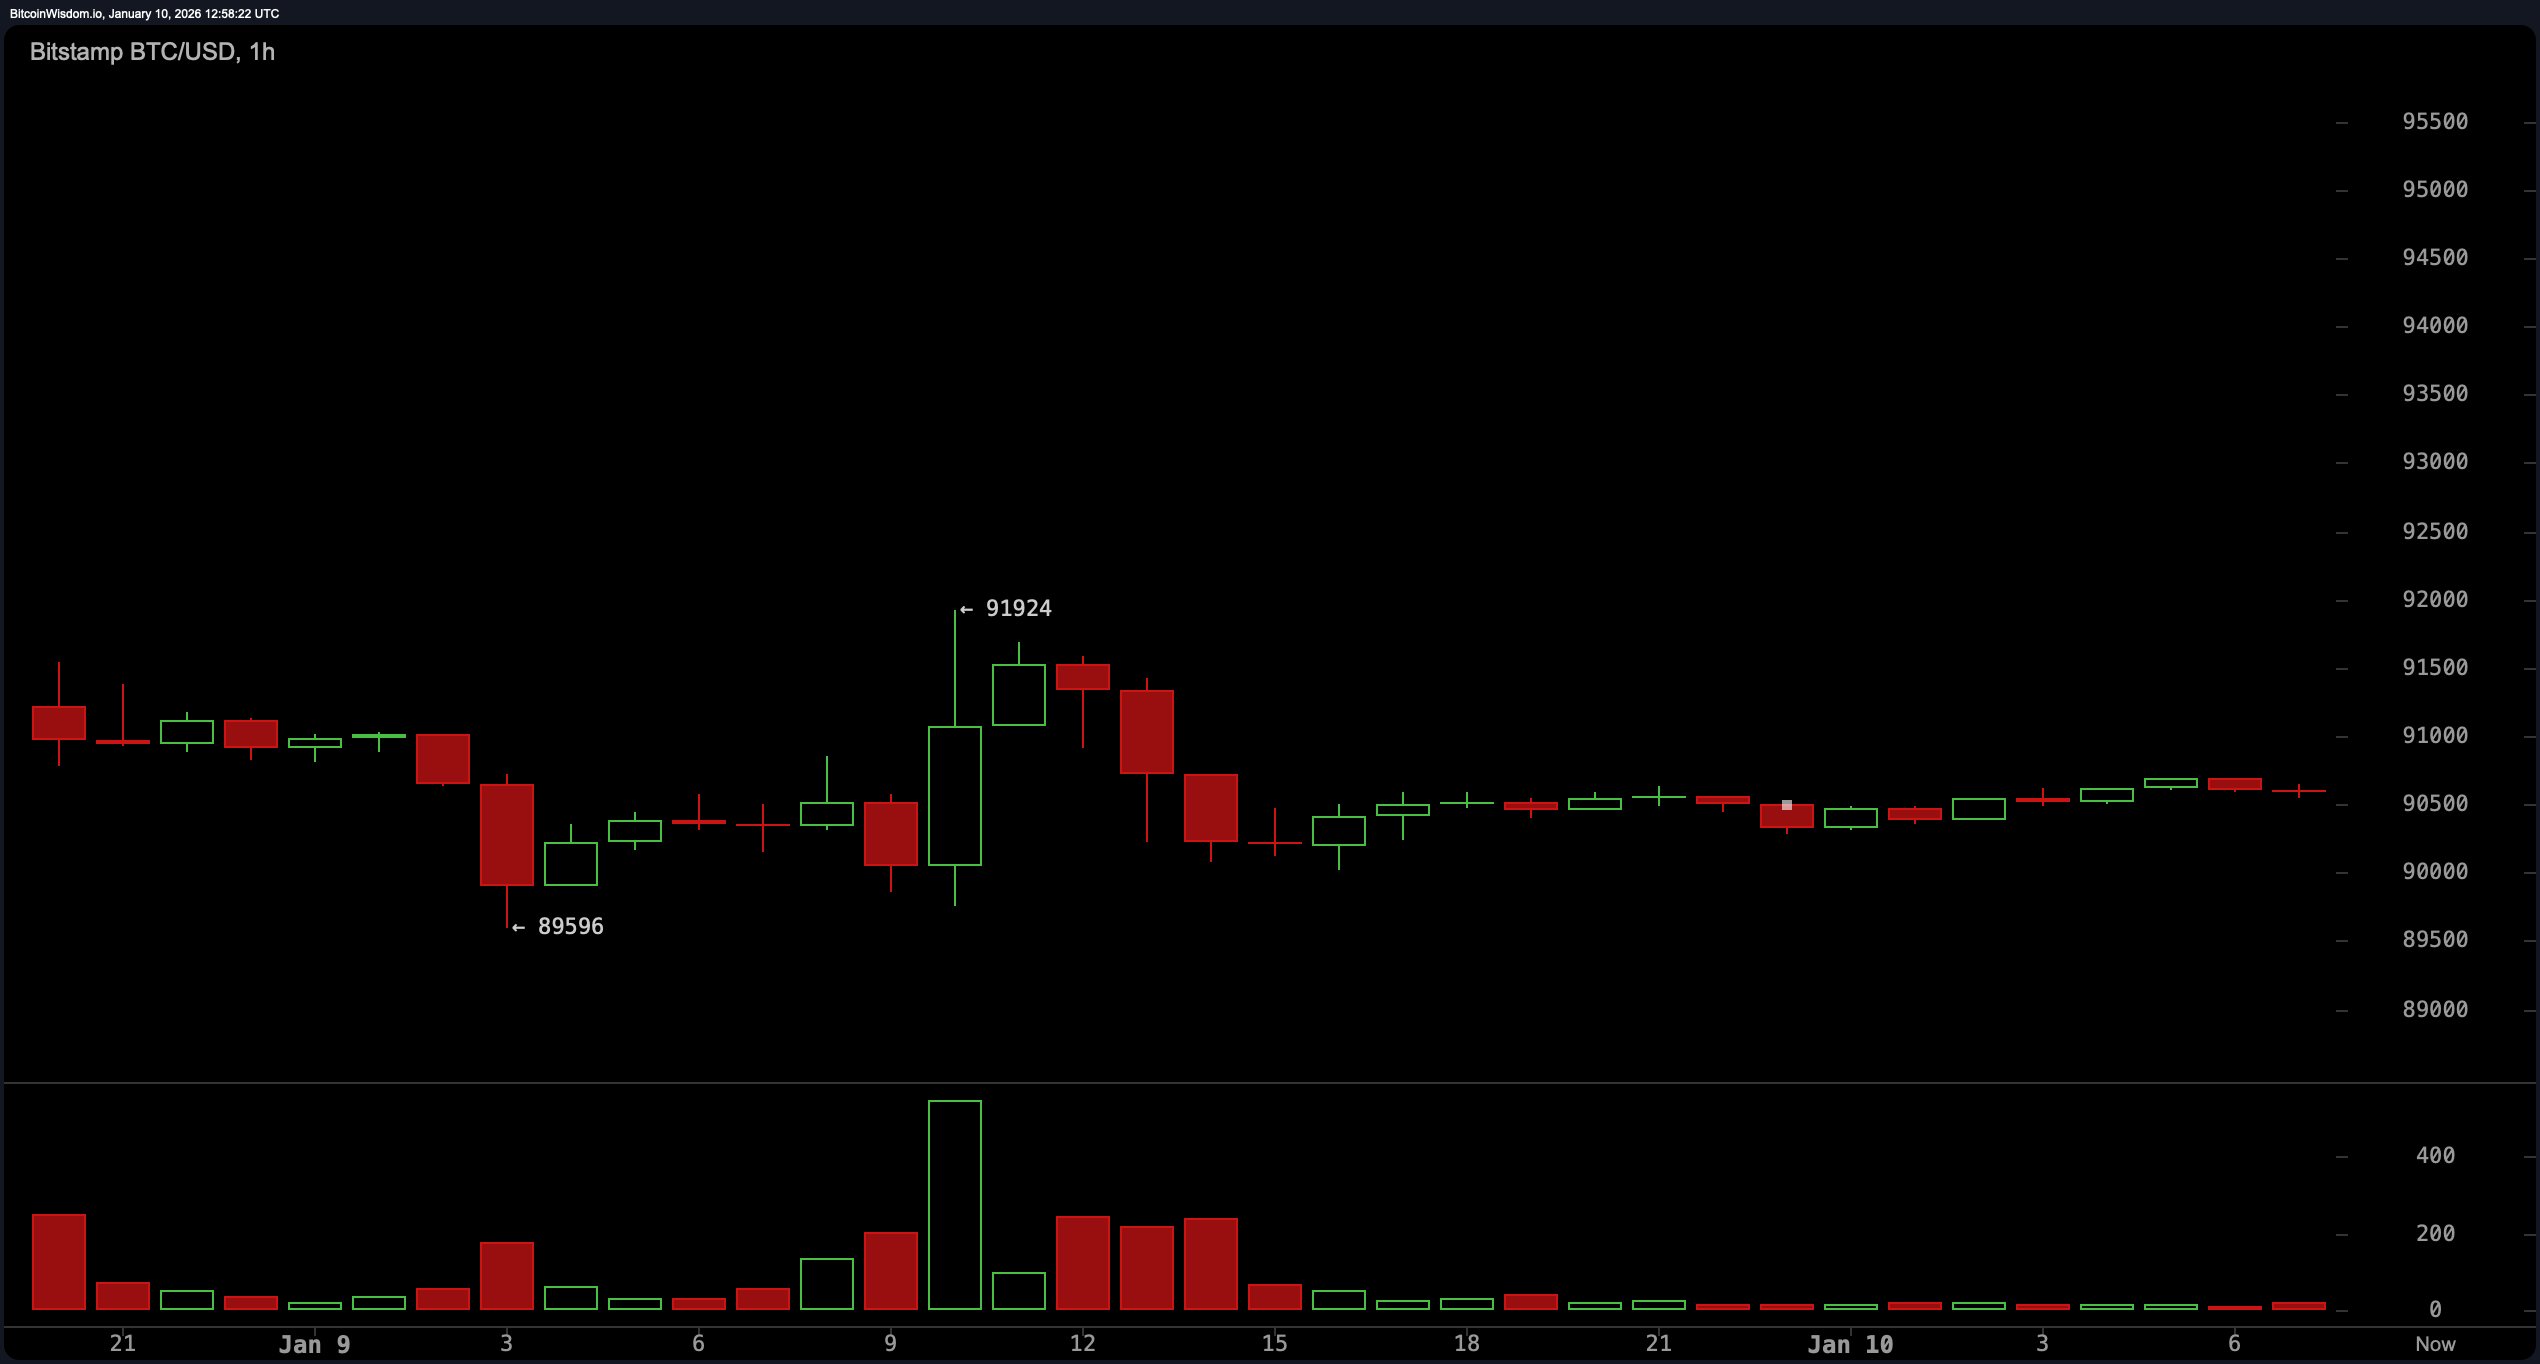
The 1-hour chart tells the story of a market stuck in a revolving door. Bitcoin is still rangebound between $90,500 and $91,500, with intraday attempts at breakout swiftly rejected, including a failed push to $91,924. Volume here is equally lifeless, and volatility has taken a smoke break. This environment suits only the nimblest of scalpers, with micro-opportunities lurking between known support and resistance levels—but the lack of conviction makes overstaying any trade a costly gamble.
Oscillator readings echo this ambivalence. The relative strength index (RSI) at 52, Stochastic at 50, and commodity channel index (CCI) at 45 all flash neutral. The average directional index (ADX) confirms a lack of trend strength at 24, while the Awesome oscillator meanders near 1,941 with no clear signal. The momentum indicator at 3,101 and the moving average convergence divergence (MACD) level at 509 are the lone voices leaning bullish, but without confirmation from other indicators, they feel more like hope than certainty.
As for moving averages (MAs), it’s a tug-of-war across the board. Short- and mid-term exponential moving averages (EMA) and simple moving averages (SMA) split between favoring upward and downward trends: the 10-day EMA and SMA are both flashing red, while the 20-day and 30-day averages lean green. Longer-term indicators are decisively bearish—the 100-day and 200-day EMAs and SMAs are all deep in red territory, suggesting the macro trend is still cooling off despite near-term stabilization. It’s a sideways shuffle, and until bitcoin clears $92,000 or cracks below $90,000, the charts are calling for patience, not predictions.
Bull Verdict:
If bitcoin can reclaim $92,000 with conviction and volume, short-term momentum could return, setting up a path toward retesting the $94,000 to $95,000 range. Support from mid-term moving averages and bullish signals from the momentum indicator and moving average convergence divergence (MACD) offer some tailwinds—assuming the bulls can stay awake.
Bear Verdict:
With price action stuck beneath key resistance and a potential bear flag brewing on the 4-hour chart, bitcoin risks slipping below the $90,000 mark. Weak volume on upticks and bearish pressure from long-term moving averages suggest the recent uptrend is cooling off—and downside toward $88,500 may be back on the menu.
FAQ ❓
- What is bitcoin’s current price?
As of 8:45 a.m. Eastern time, Saturday, Jan. 10, 2026, bitcoin is priced at $90,617. - Is bitcoin in an uptrend or downtrend?
Bitcoin is currently consolidating after a recent uptrend, showing signs of short-term indecision. - What is bitcoin’s trading range today?
The 24-hour price band is between $89,596 and $91,924. - What are key bitcoin support and resistance levels?
Support sits near $90,000, while resistance stands around $92,000 to $95,000.