


Bitcoin’s price stands at $76,065 on Feb. 4, 2026 at 8 a.m. EST, capping a dramatic 24-hour range between $72,863 and $79,113. Its market capitalization hovered at $1.51 trillion, with $74.04 billion in trading volume keeping the digital pulse fast and furious. But while price action hinted at recovery, the technical picture tells a more tangled tale — one where bears still whisper from the shadows.
Bitcoin Finds a Floor or Flirts With the Abyss? $72.8K Is the New Lifebuoy
WRITTEN BY

SHARE

Bitcoin Chart Outlook
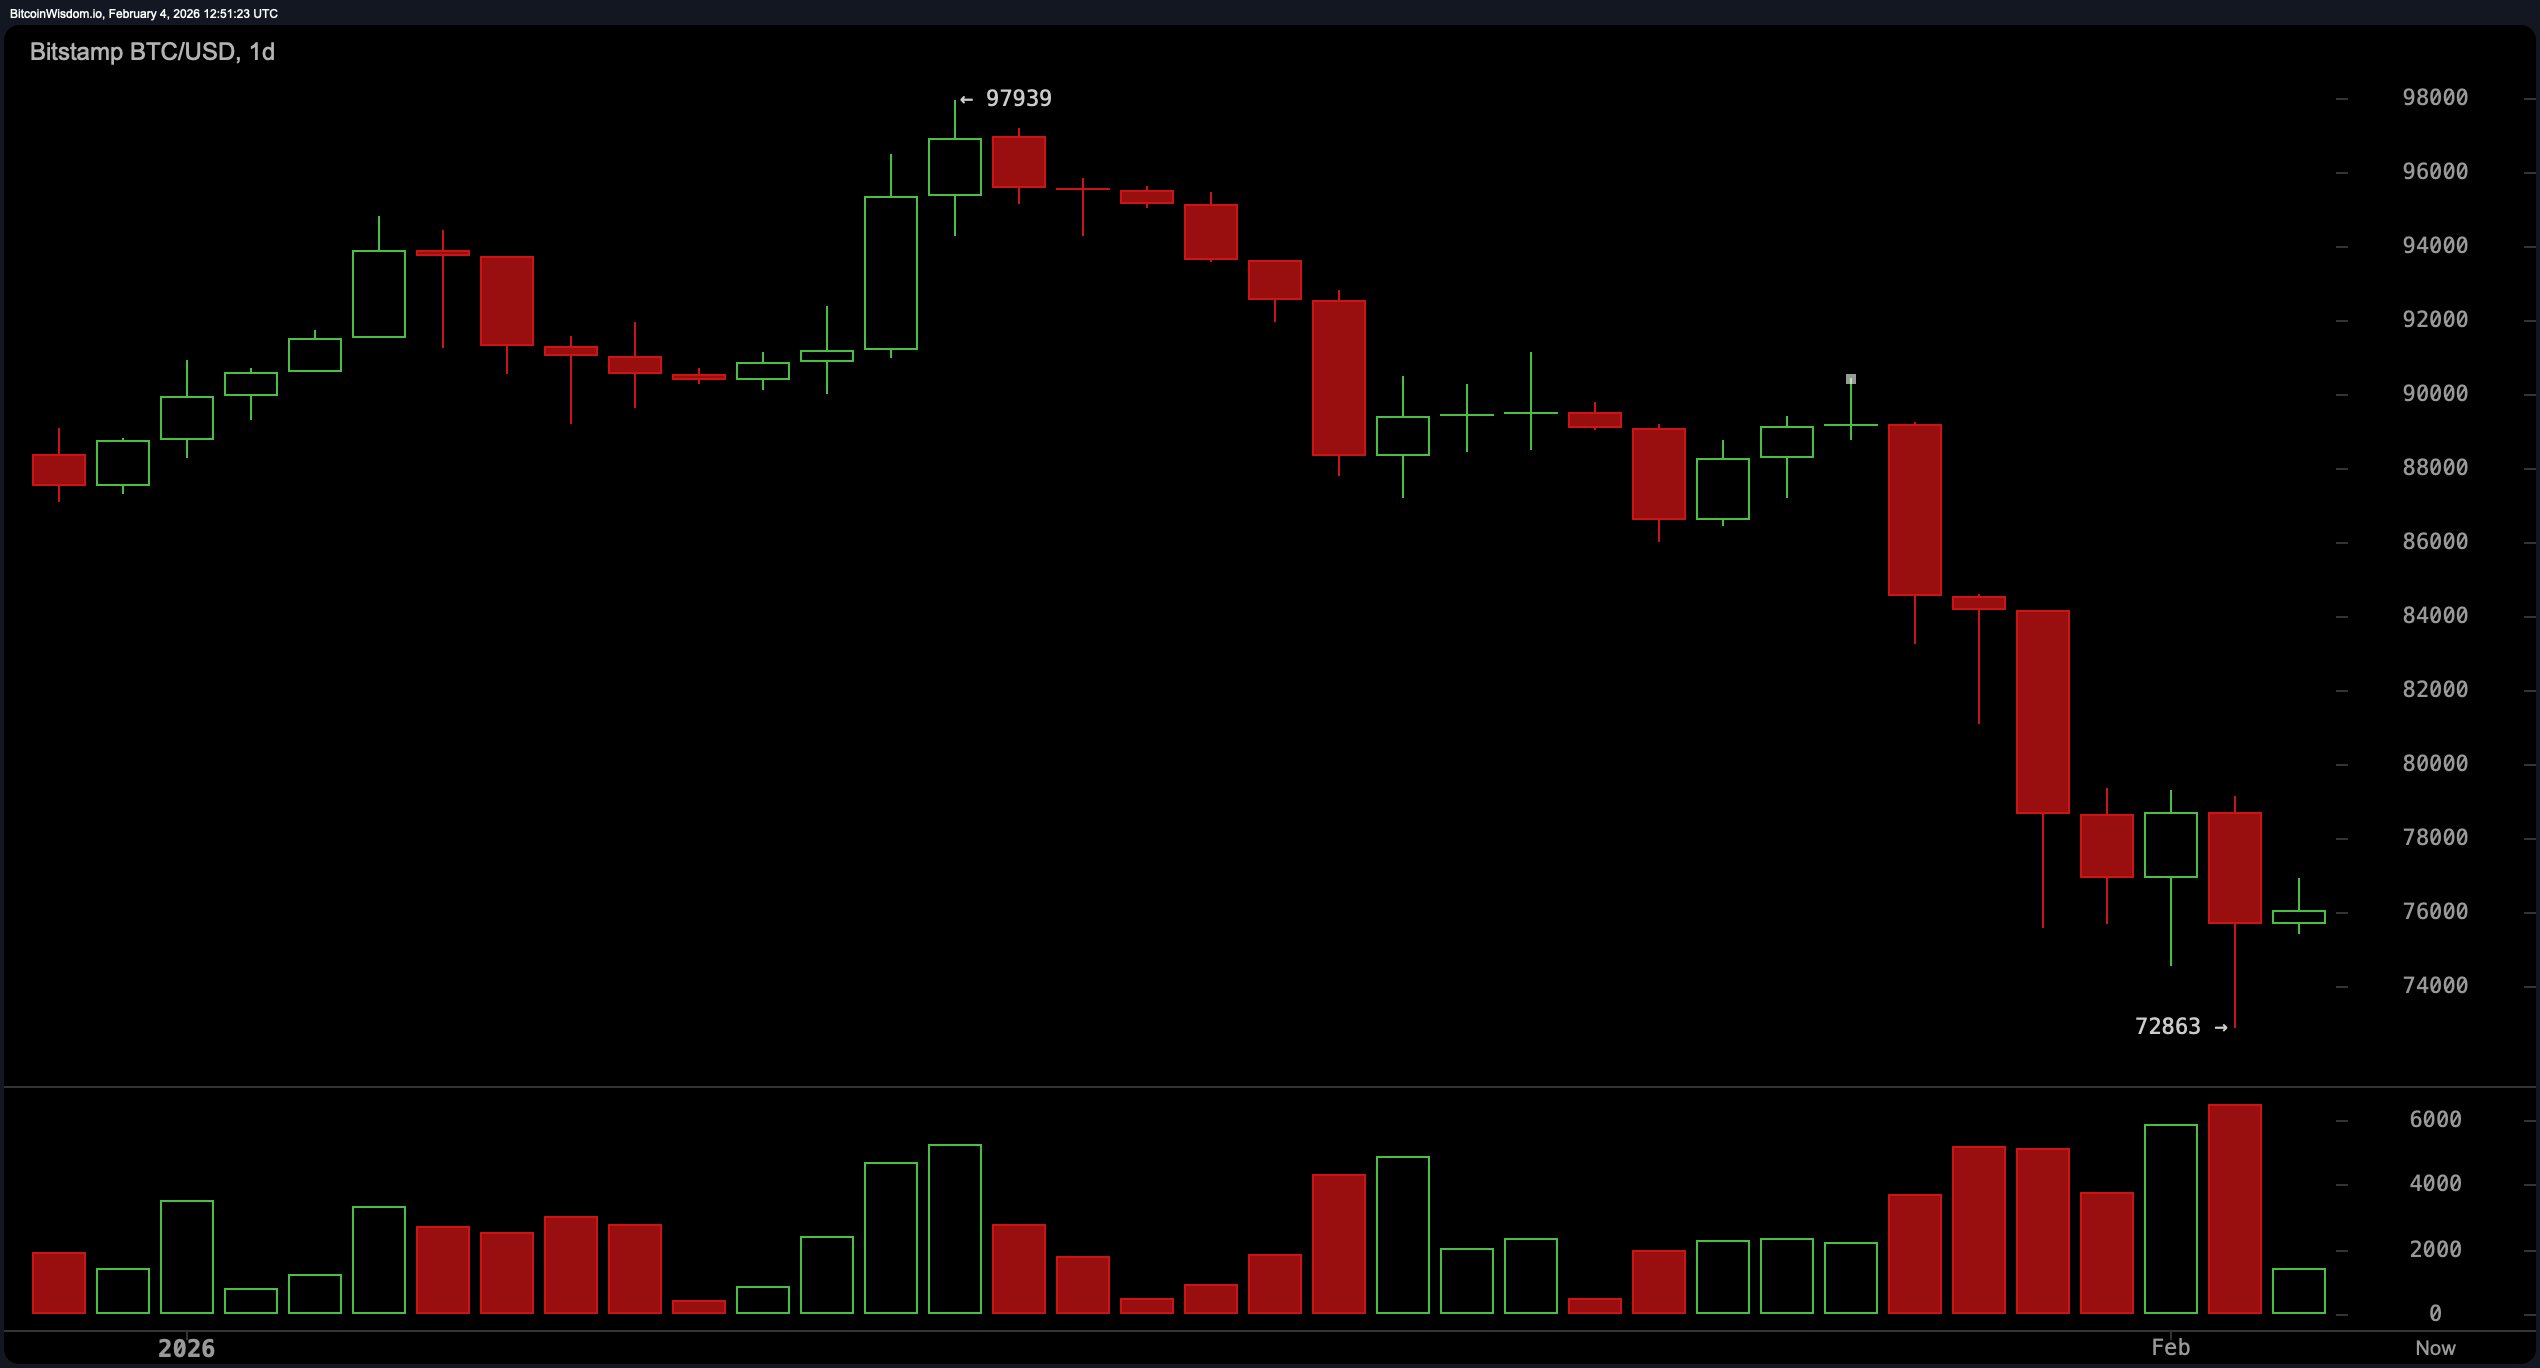
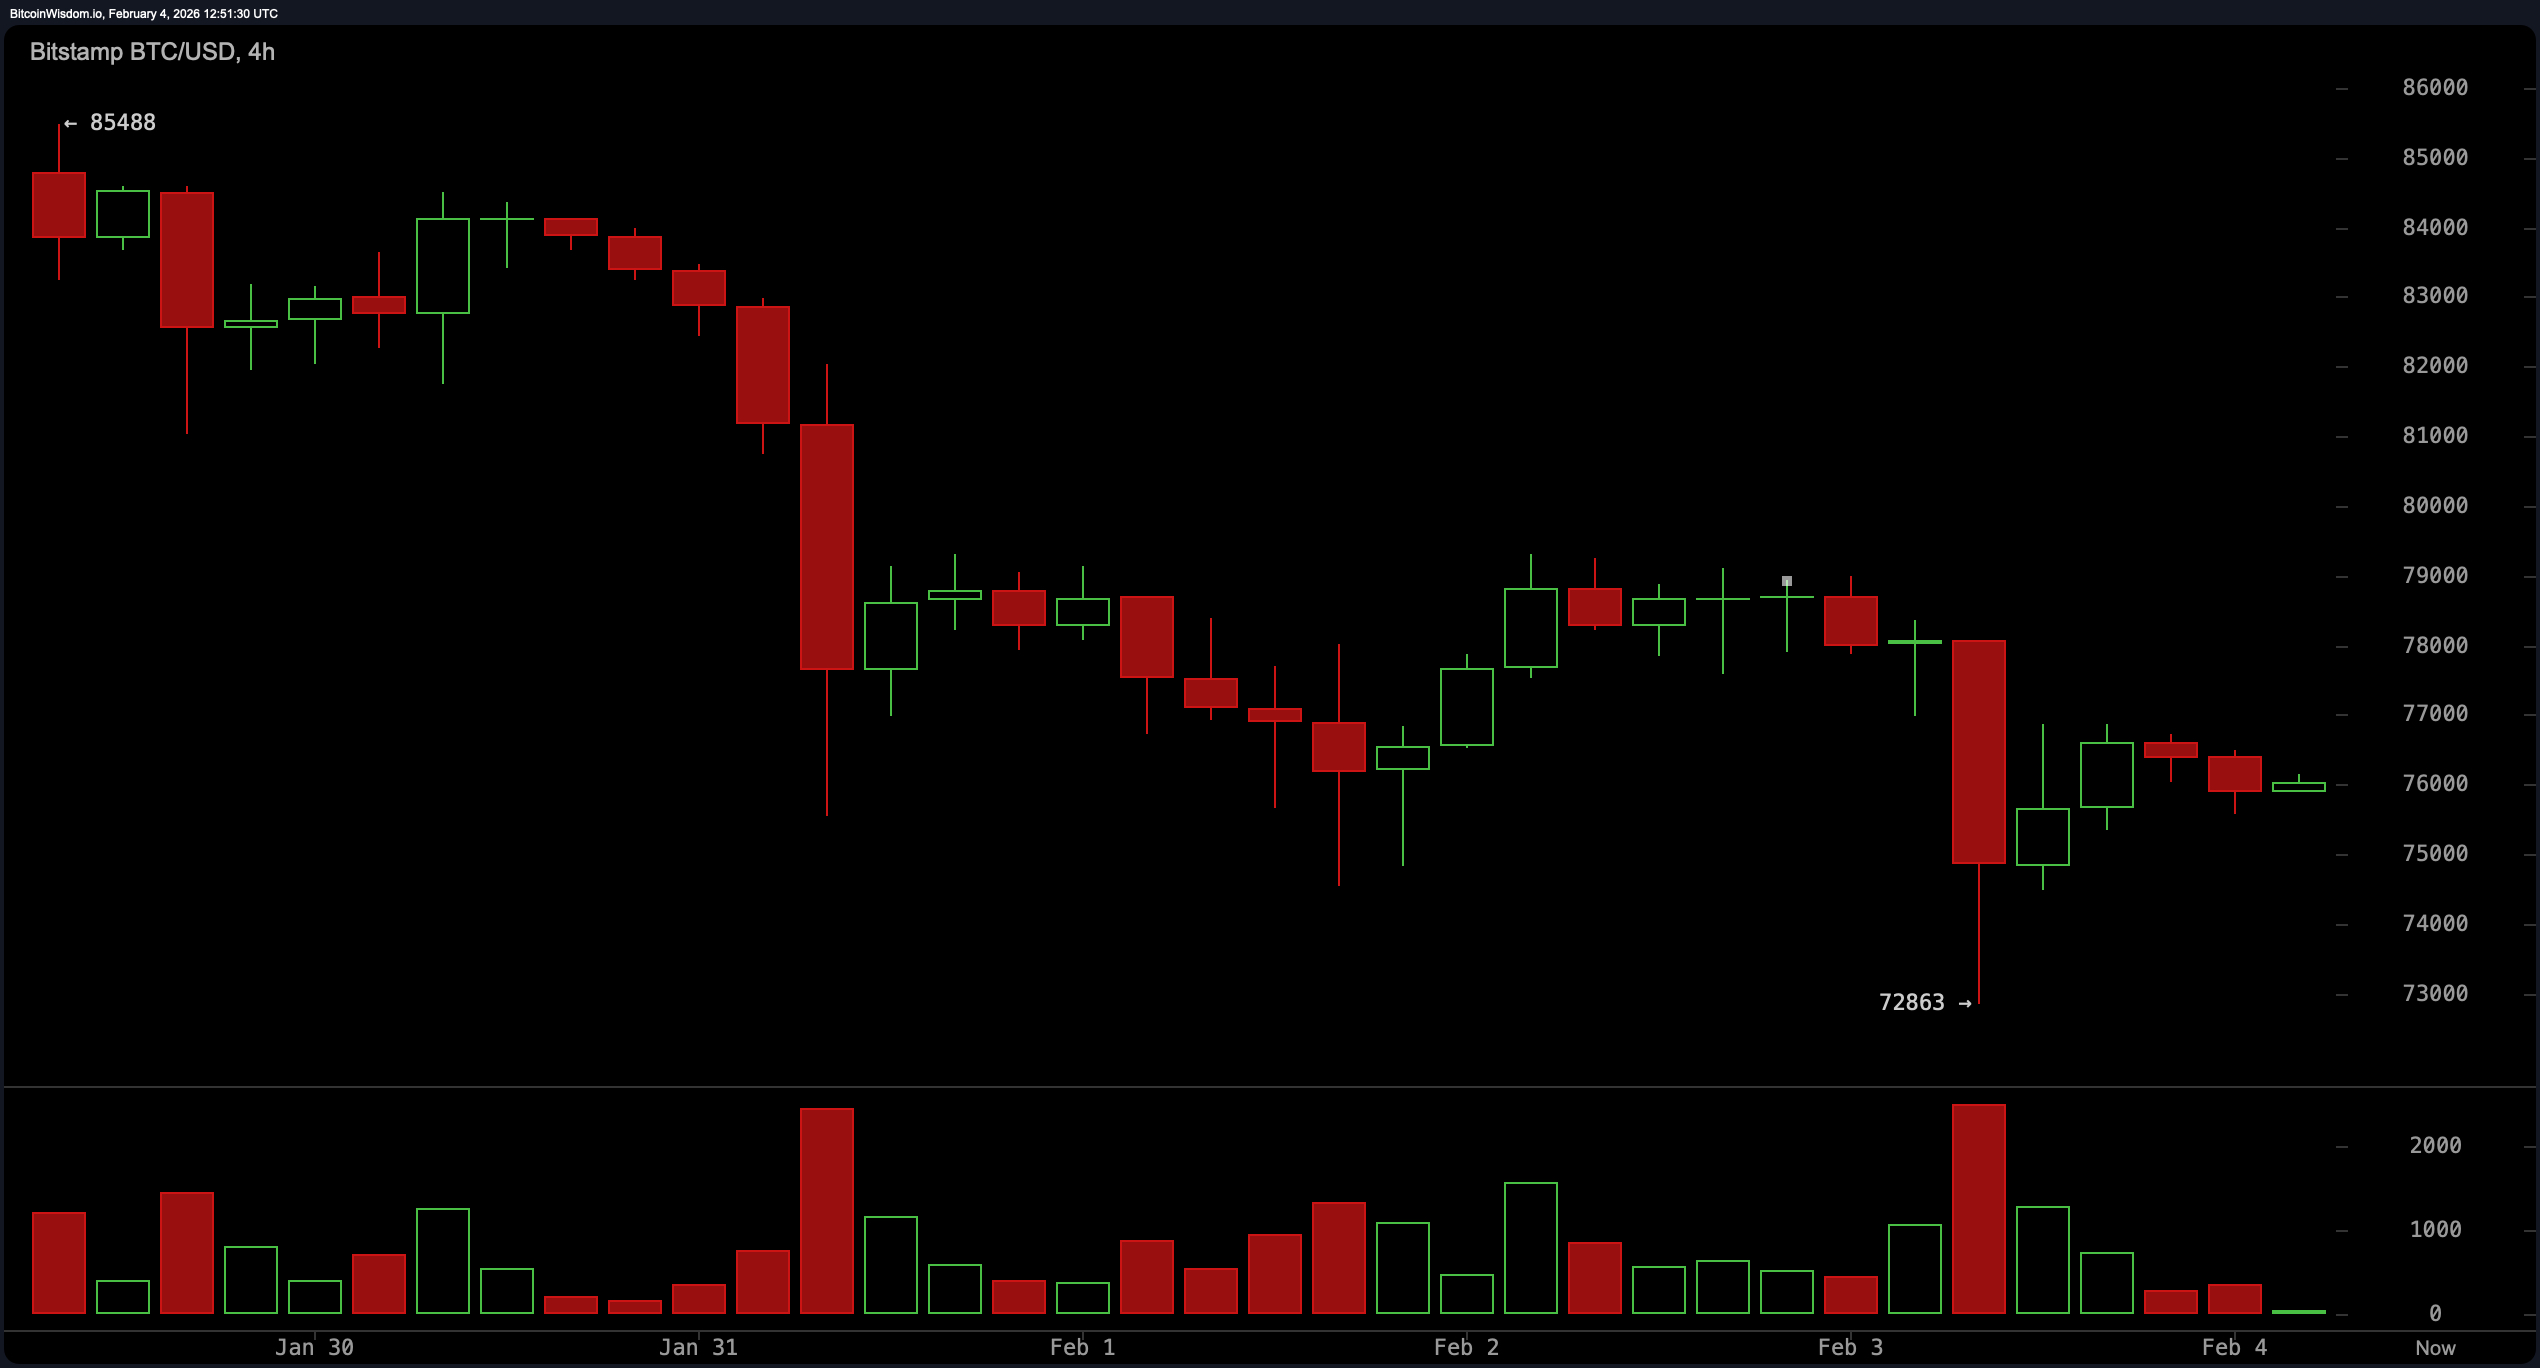
From a daily chart vantage point, bitcoin is strutting down the staircase of lower highs and lower lows, following a peak near $97,900. The descent hasn’t exactly been graceful — think more dramatic exit than controlled retreat — punctuated by a flush of sell volume that resembled capitulation more than composure.
The $72,863 low now stands as the line between breakdown and bottom, with strong structural support clinging desperately to the $72,800–$73,000 zone. Meanwhile, resistance is lounging above at $80,000–$81,000 and again near $88,000–$90,000 — former friends now turned foes.
On the four-hour chart, the market looks like it just took a deep breath. After a sharp liquidation event, price is coiling between $75,500 and $77,000, giving off major “equilibrium after chaos” energy. Long downside wicks near the $73,000 level signal that buyers haven’t ghosted the party just yet. But don’t mistake this sideways saunter for a comeback — the trend remains bearish until price can break above $79,000 and hold court. Support in this timeframe solidifies around $75,000–$75,500, while any stumbles below $72,800 would signal renewed downside risk.
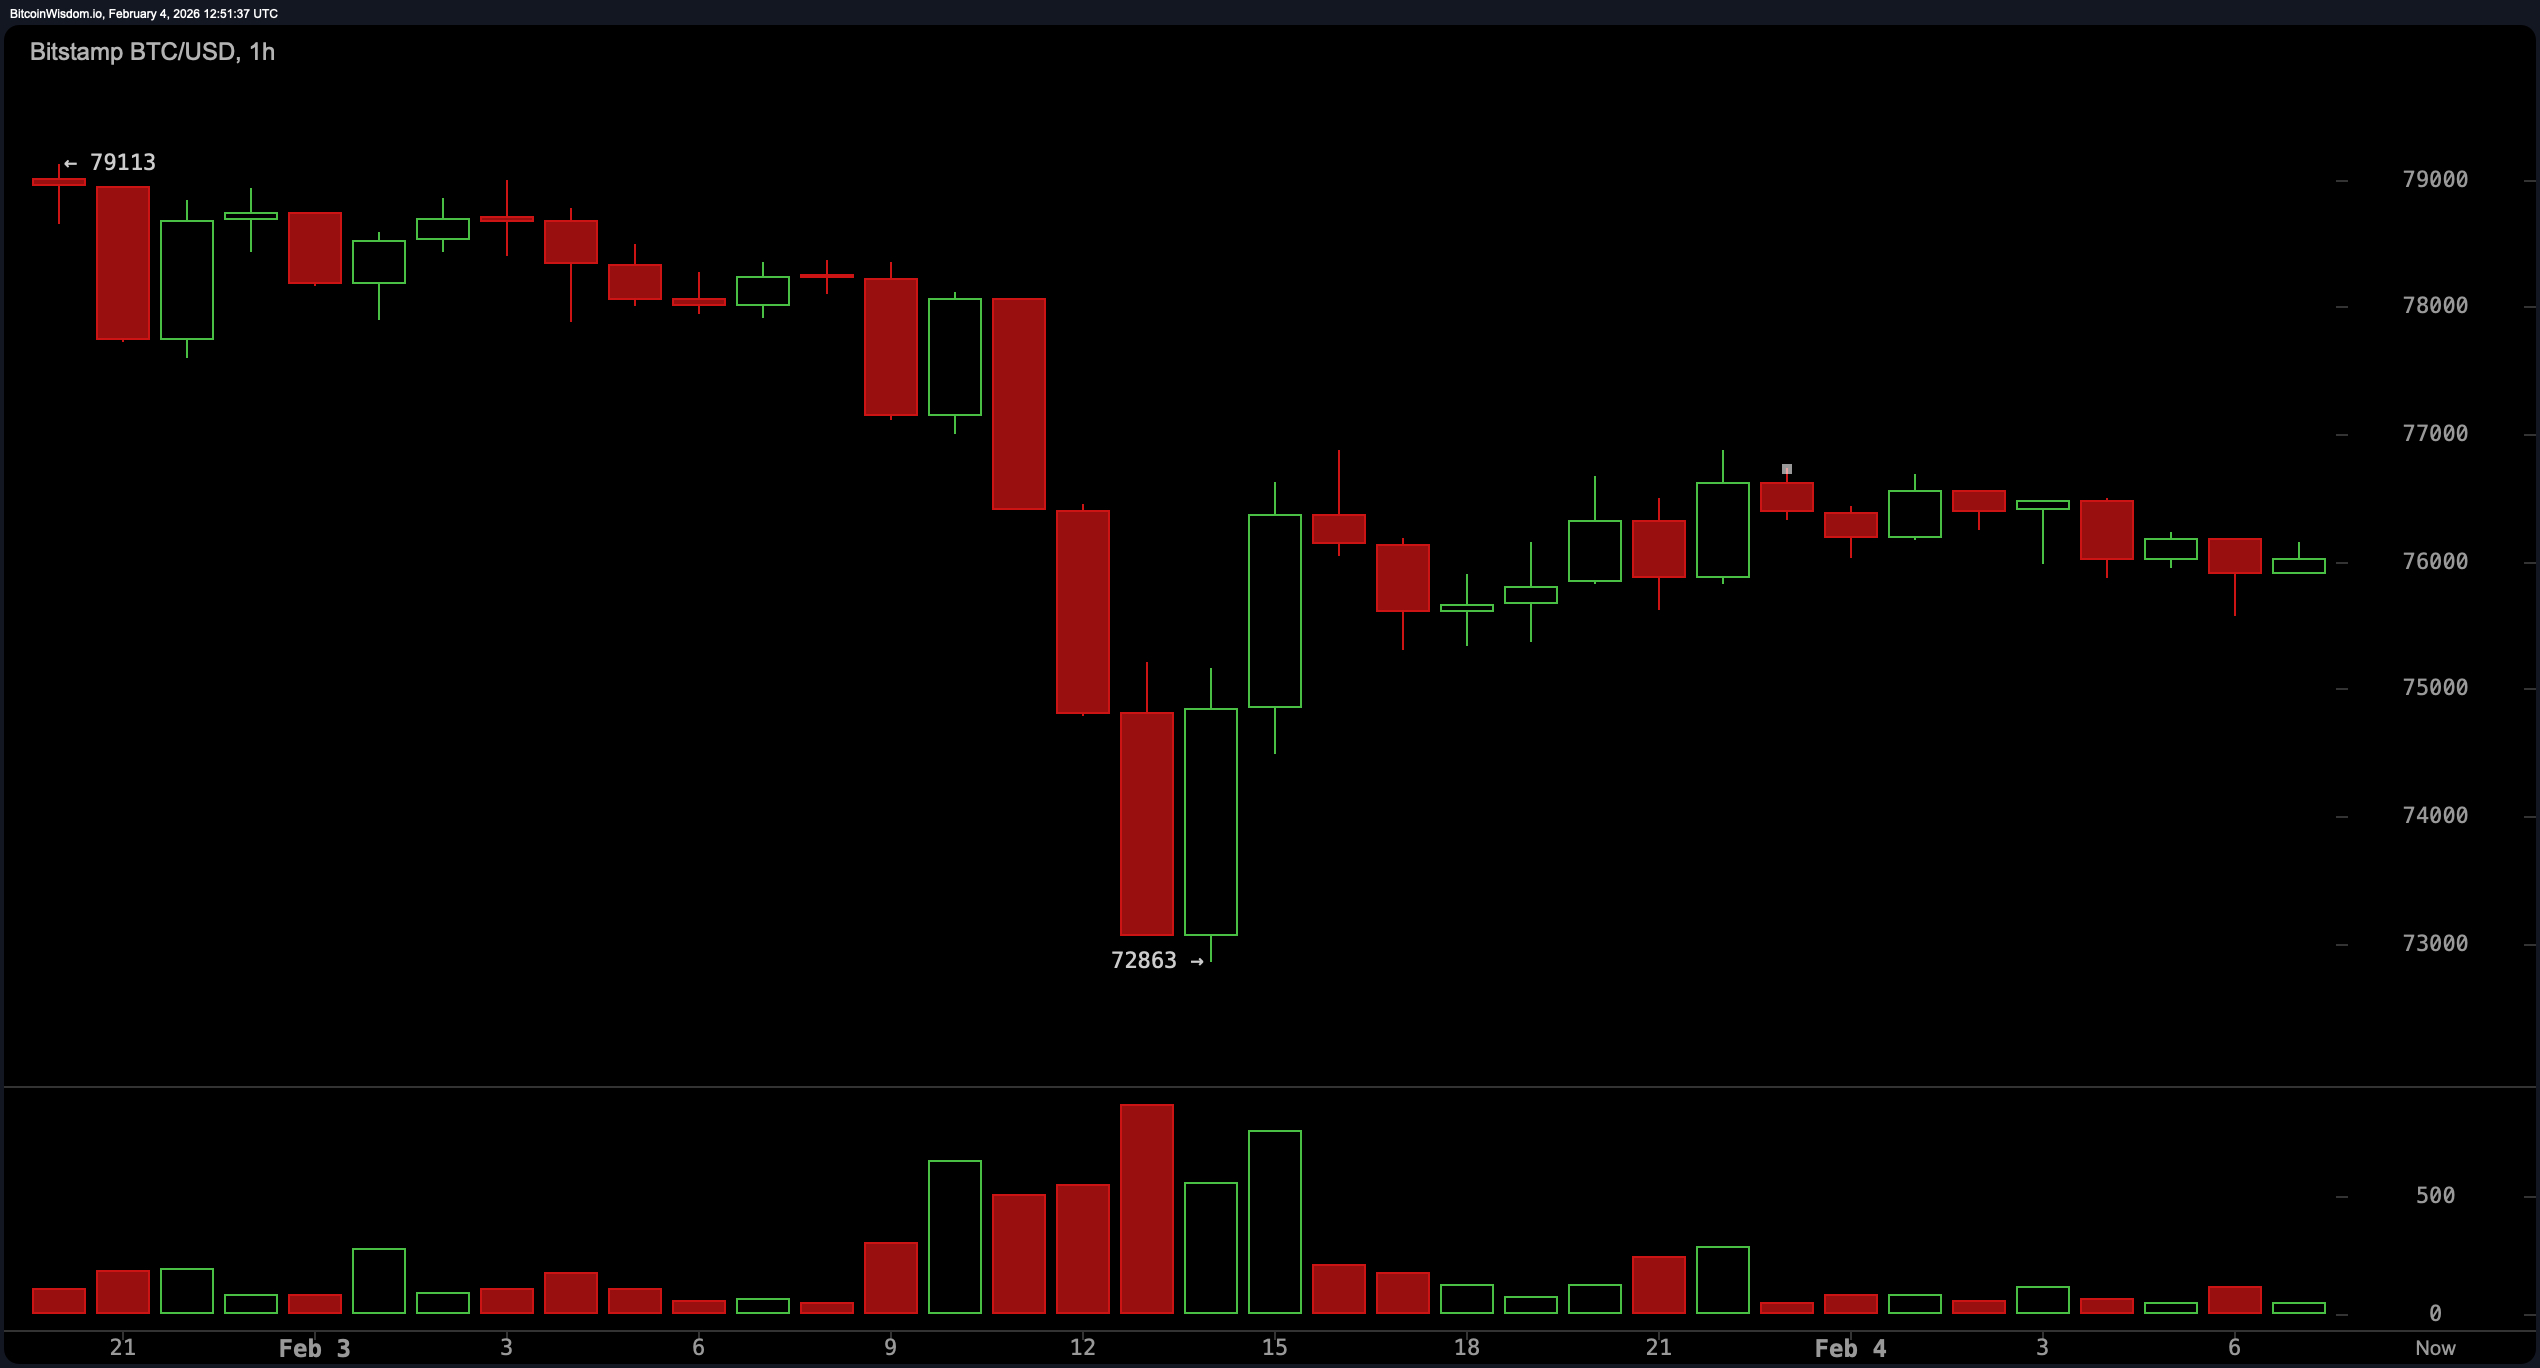
The one-hour chart tells the story of a market stuck in the chop, tiptoeing through stabilization but too shy to call it a trend reversal. Shallow higher lows suggest some buyer interest, though momentum has been suspiciously muted following the bounce off $72,863 — a textbook relief rally if there ever was one. Resistance continues to press down from $77,000–$77,500 and ultimately $79,000, which acts as a psychological tripwire for broader upside aspirations. Immediate support resides between $75,500–$76,000, with $74,000–$74,500 offering a backup cushion.
Oscillators paint an intriguingly split picture, giving technical analysts reason to raise an eyebrow. The relative strength index (RSI) comes in at 27, flirting with oversold territory, while the stochastic oscillator clocks in at 18 — both suggesting exhaustion in selling pressure. The commodity channel index (CCI) confirms with a reading of −137. Meanwhile, momentum sits at −10,552, still weighed down but implying potential reversal fuel. But let’s not ignore the elephant in the room: the moving average convergence divergence (MACD) at −3,730 is still flashing caution.
Moving averages are no more forgiving. The exponential moving average (EMA) and simple moving average (SMA) across all standard periods — from 10-day through 200-day — are pointed squarely in the same direction: not up. For example, the 10-day EMA and SMA stand at $80,908 and $82,108 respectively, both towering above current price like skeptical gatekeepers. The 200-day EMA and SMA are even more daunting, at $97,127 and $103,319. The message is clear: momentum needs more than a good haircut to clean this up.
In short, bitcoin’s price may be pausing for breath, but the technicals are still pacing nervously. Until price takes out $79,000 with conviction or breaks below $72,800 in despair, this market remains stuck in purgatory — waiting for a catalyst, a direction, or maybe just a little less drama.
Bull Verdict:
If you’re a market optimist, there’s just enough structure here to raise an eyebrow. The bounce off $72,863, oversold oscillators like the relative strength index (RSI) and stochastic oscillator, and evidence of base-building across intraday charts suggest the potential for a relief leg higher. A confirmed breakout above $79,000 could spark renewed upside momentum, with targets stretching toward $81,000 and beyond—assuming momentum decides to RSVP.
Bear Verdict:
For the skeptics in the room, bitcoin still hasn’t cleared its technical baggage. The dominant trend remains bearish, all moving averages are unsupportive, and the moving average convergence divergence (MACD) is still flashing warning lights. Until price can decisively reclaim key resistance zones and reverse the pattern of lower highs, any rally risks becoming just another trap door in disguise.
FAQ
- What is the current bitcoin price on Feb. 4, 2026?
bitcoin is trading at $76,065 with a 24-hour range of $72,863 to $79,113. - Is bitcoin in a bullish or bearish trend right now?
bitcoin remains in a short-term consolidation within a broader bearish trend. - What are key support and resistance levels for bitcoin today?
Key support sits at $72,800, while resistance looms near $79,000 and $81,000. - Are technical indicators suggesting a reversal in bitcoin’s price?
Some oscillators hint at oversold conditions, but moving averages still point down.